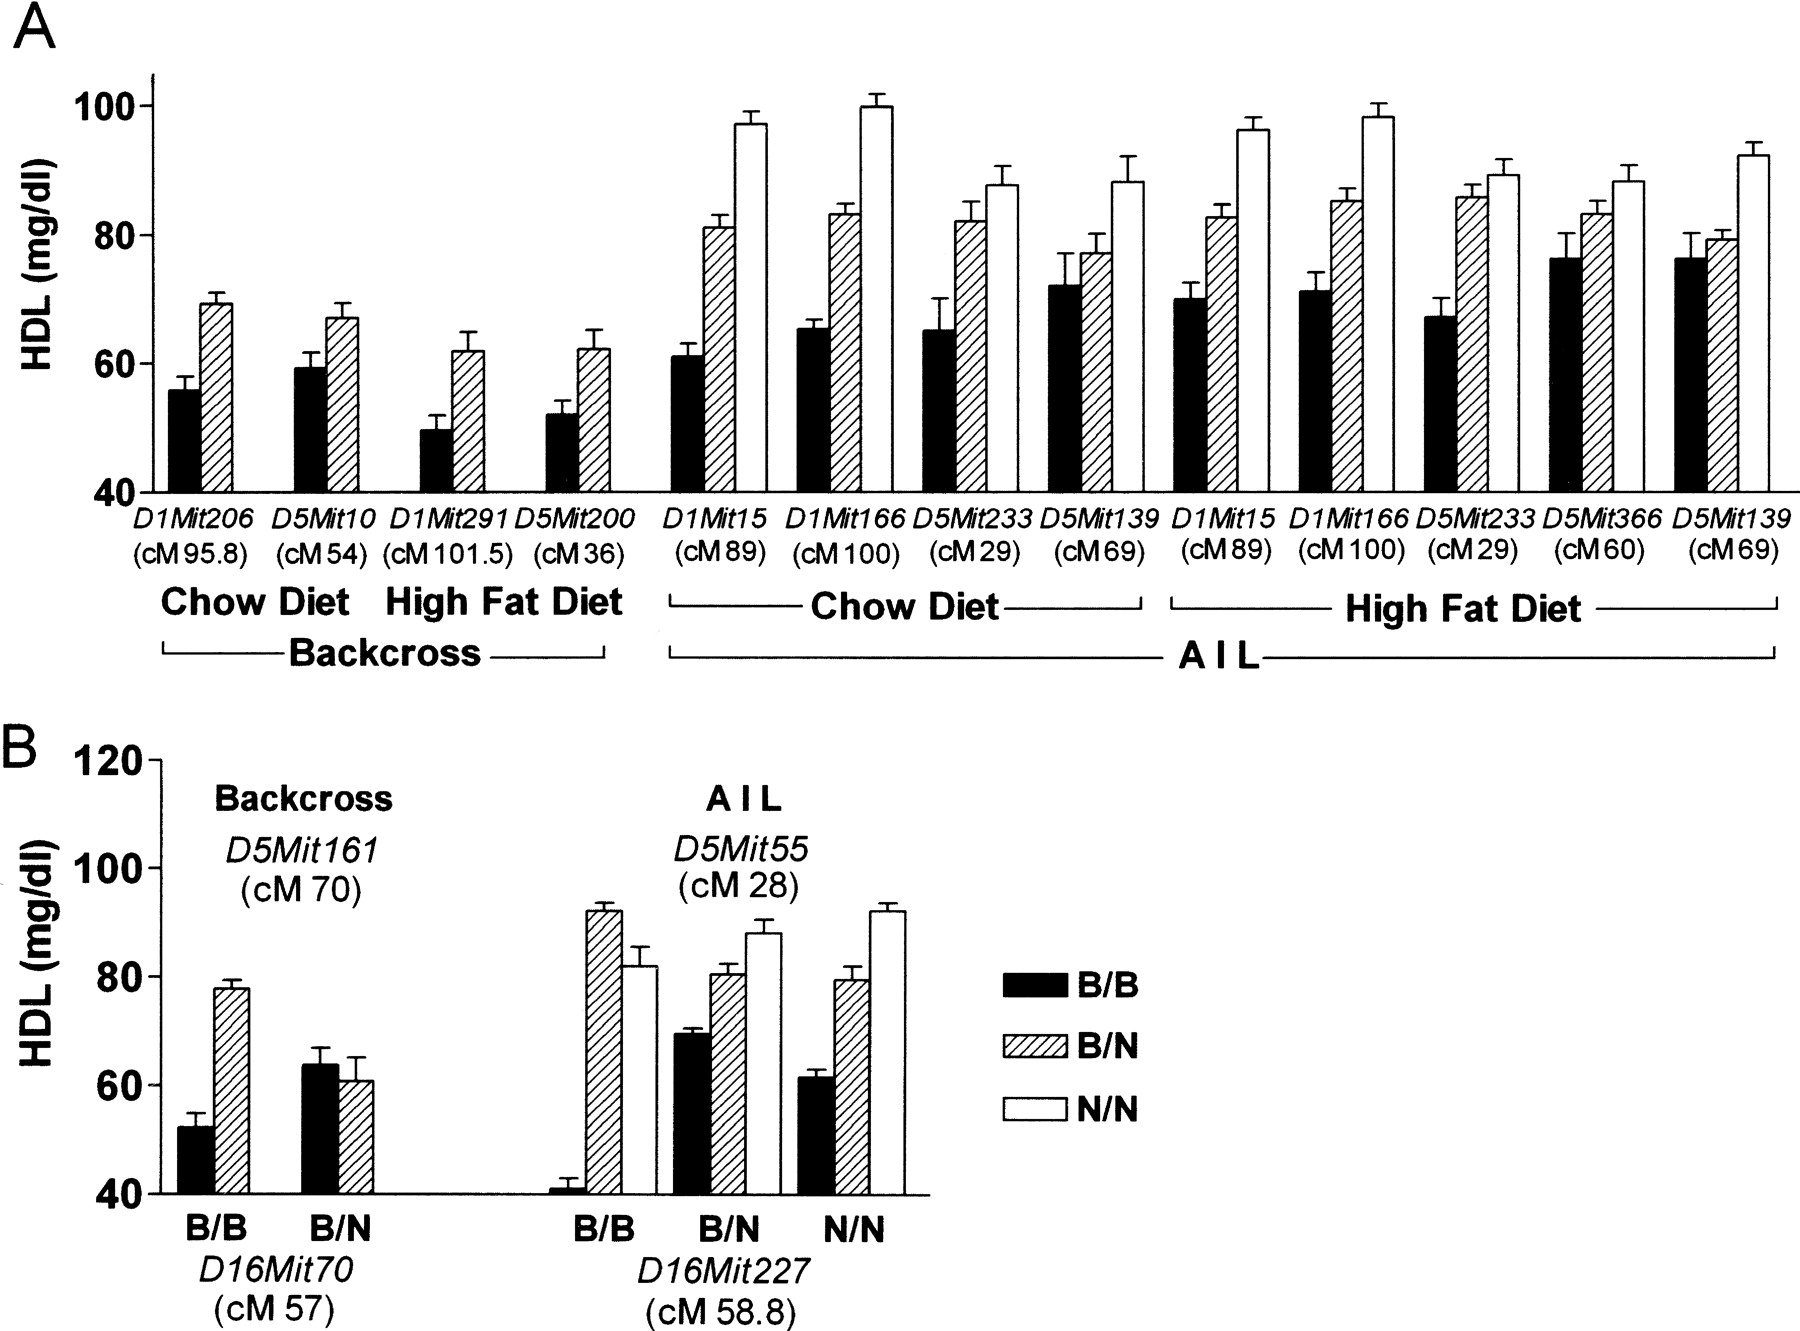
Figure 4
Allele effect and interaction plots for the QTLs found in the (B6 × NZB)F1 × B6 backcross and in the (B6 × NZB)F11 AIL. (A) Genotypes at marker alleles nearest each QTL identified in the backcross and AIL-affected HDL concentrations in chow-fed and high-fat diet–fed progeny (4 weeks for backcross progeny and 6 weeks for AIL progeny). (B) Genotypes at marker alleles closest to the Chr 5 and 16 QTLs identified in the backcross and AIL interacted to affect HDL concentrations of chow-fed backcross AIL progeny. All HDL concentrations are plotted as mean ± SEM (mg/dL).