Figure 1
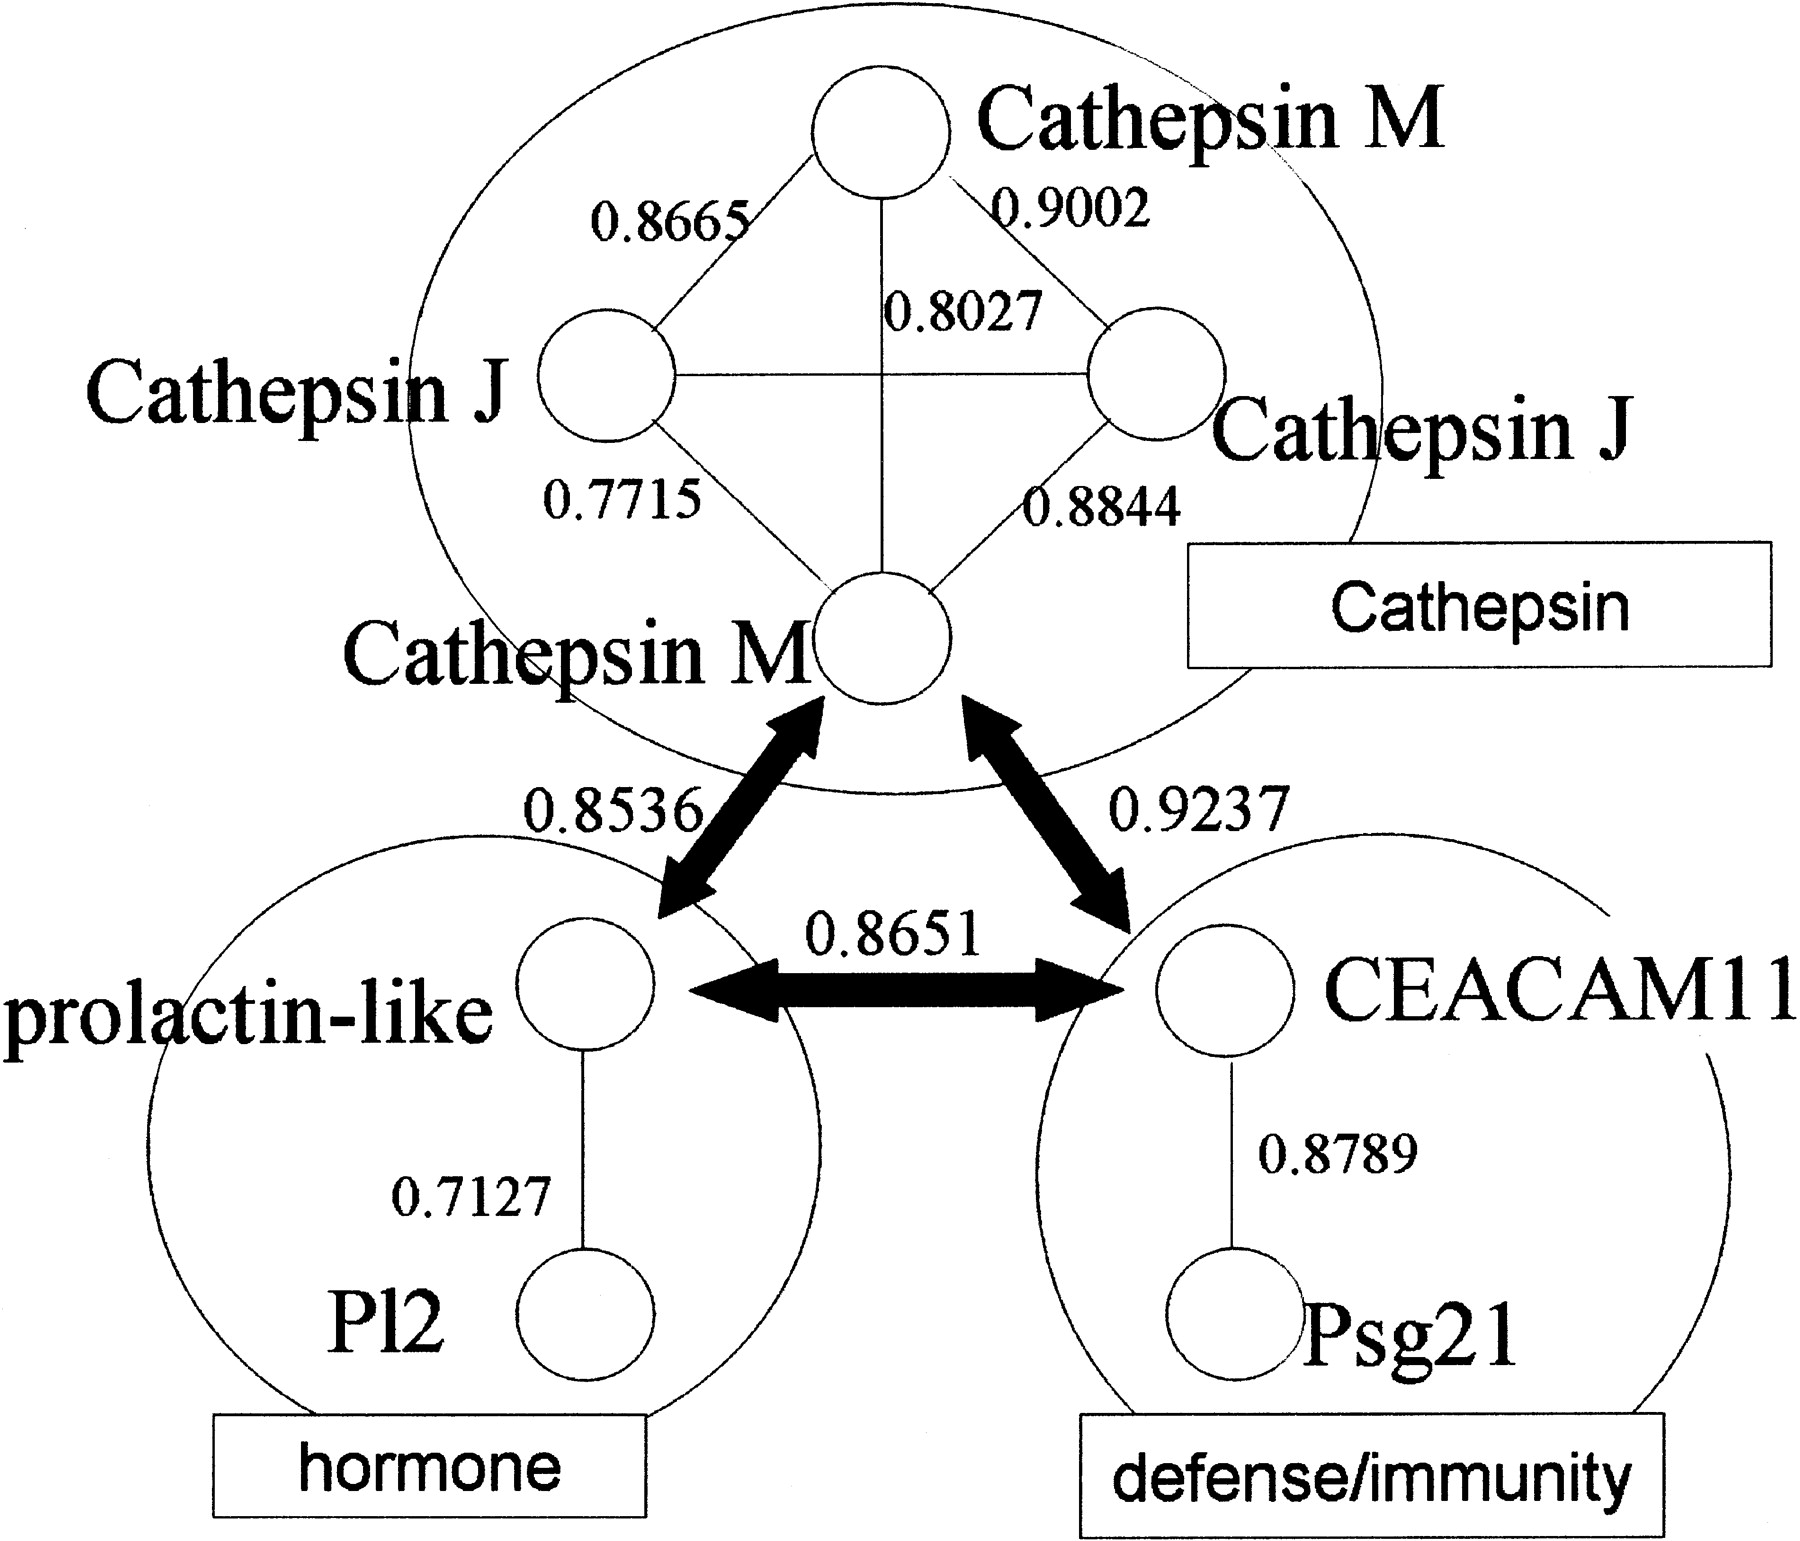
An obtained cluster with seven clones. Each small circle represents a clone, and edges represent the correlation coefficients between clones. The seven clones are categorized into three groups.
An obtained cluster with seven clones. Each small circle represents a clone, and edges represent the correlation coefficients between clones. The seven clones are categorized into three groups.