Figure 2
Comparative diagram of the GO Slim categories for different eukaryotic proteomes. The y-axis shows the number of proteins; the x-axis shows GO categories (see Fig. 1).
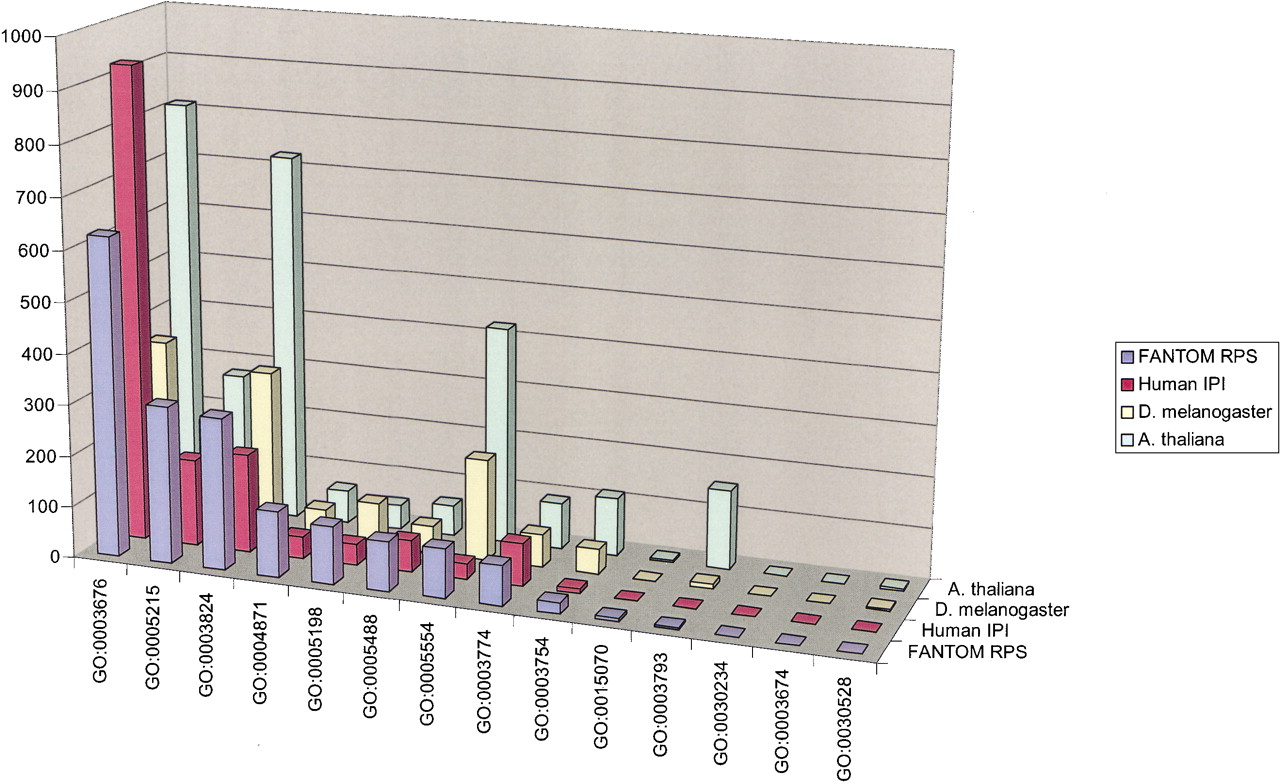
Comparative diagram of the GO Slim categories for different eukaryotic proteomes. The y-axis shows the number of proteins; the x-axis shows GO categories (see Fig. 1).