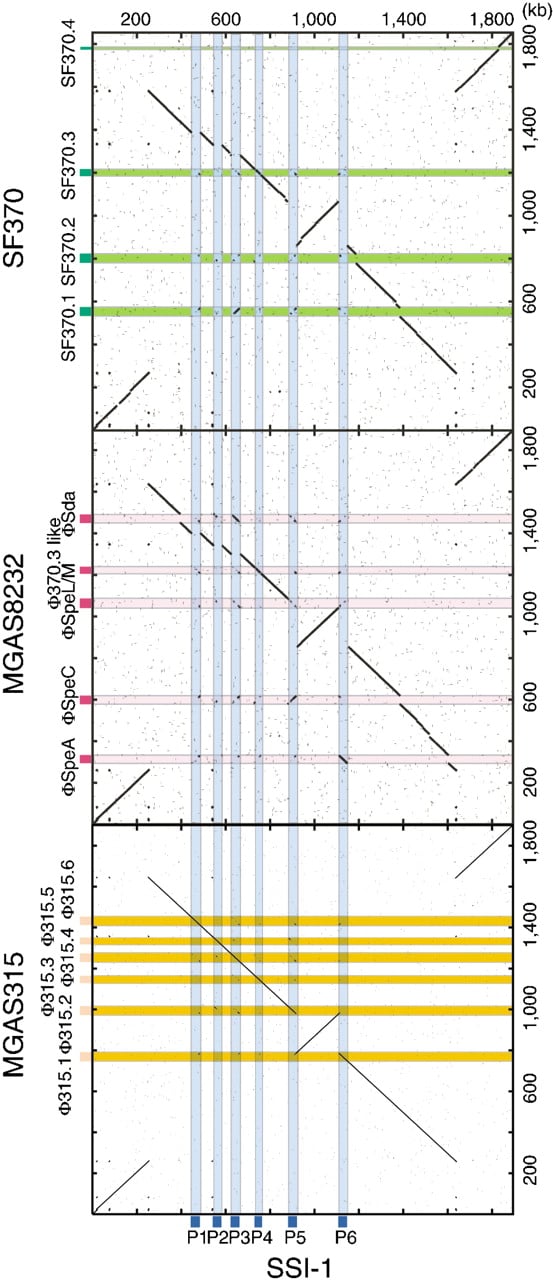
Figure 2
Comparison of the three sequenced GAS genomes based on the chromosomal organization of strain SSI-1. Dot-plot analyses were performed based on the genomic sequence of strain SSI-1 and the other three GAS strains (SF370, MGAS8232, and MGAS315). Deflection of segments along either axis indicates insertions of DNA segments. Segments not aligning along the diagonal line represent sequences that are similar but located in different parts of the genomes. Light blue, SSI-1-specific phages; pink, MGAS8232-specific phages; light green, SF370-specific phages; light orange, MGAS315-specific phages.