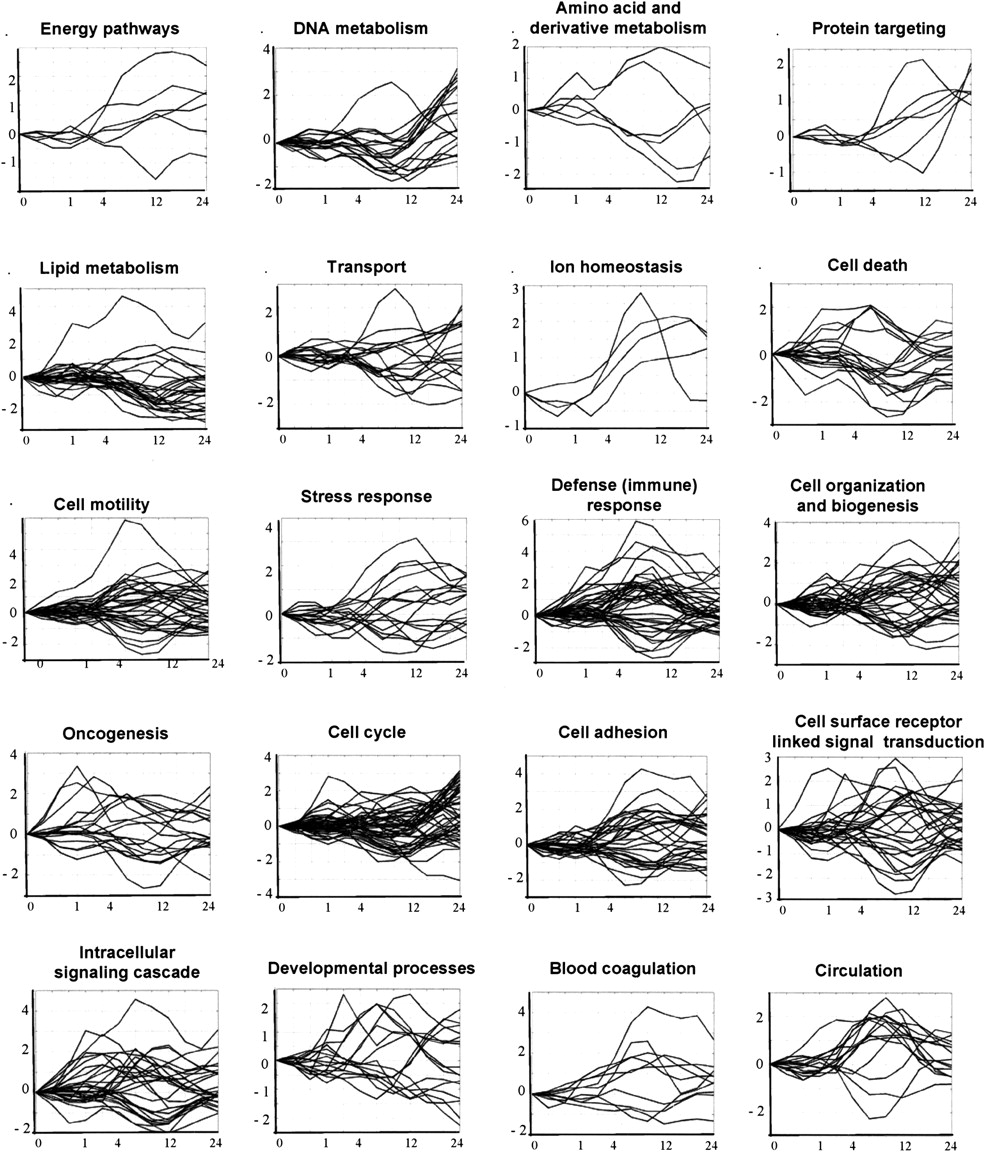
Figure 1.
Expression profiles for different biological process function-class training example genes. The x-axis shows time, and they-axis shows log2-transformed gene expression ratios (serum treated vs. control). Expression profiles for the three processes not shown in this figure are shown in Figure 3A.