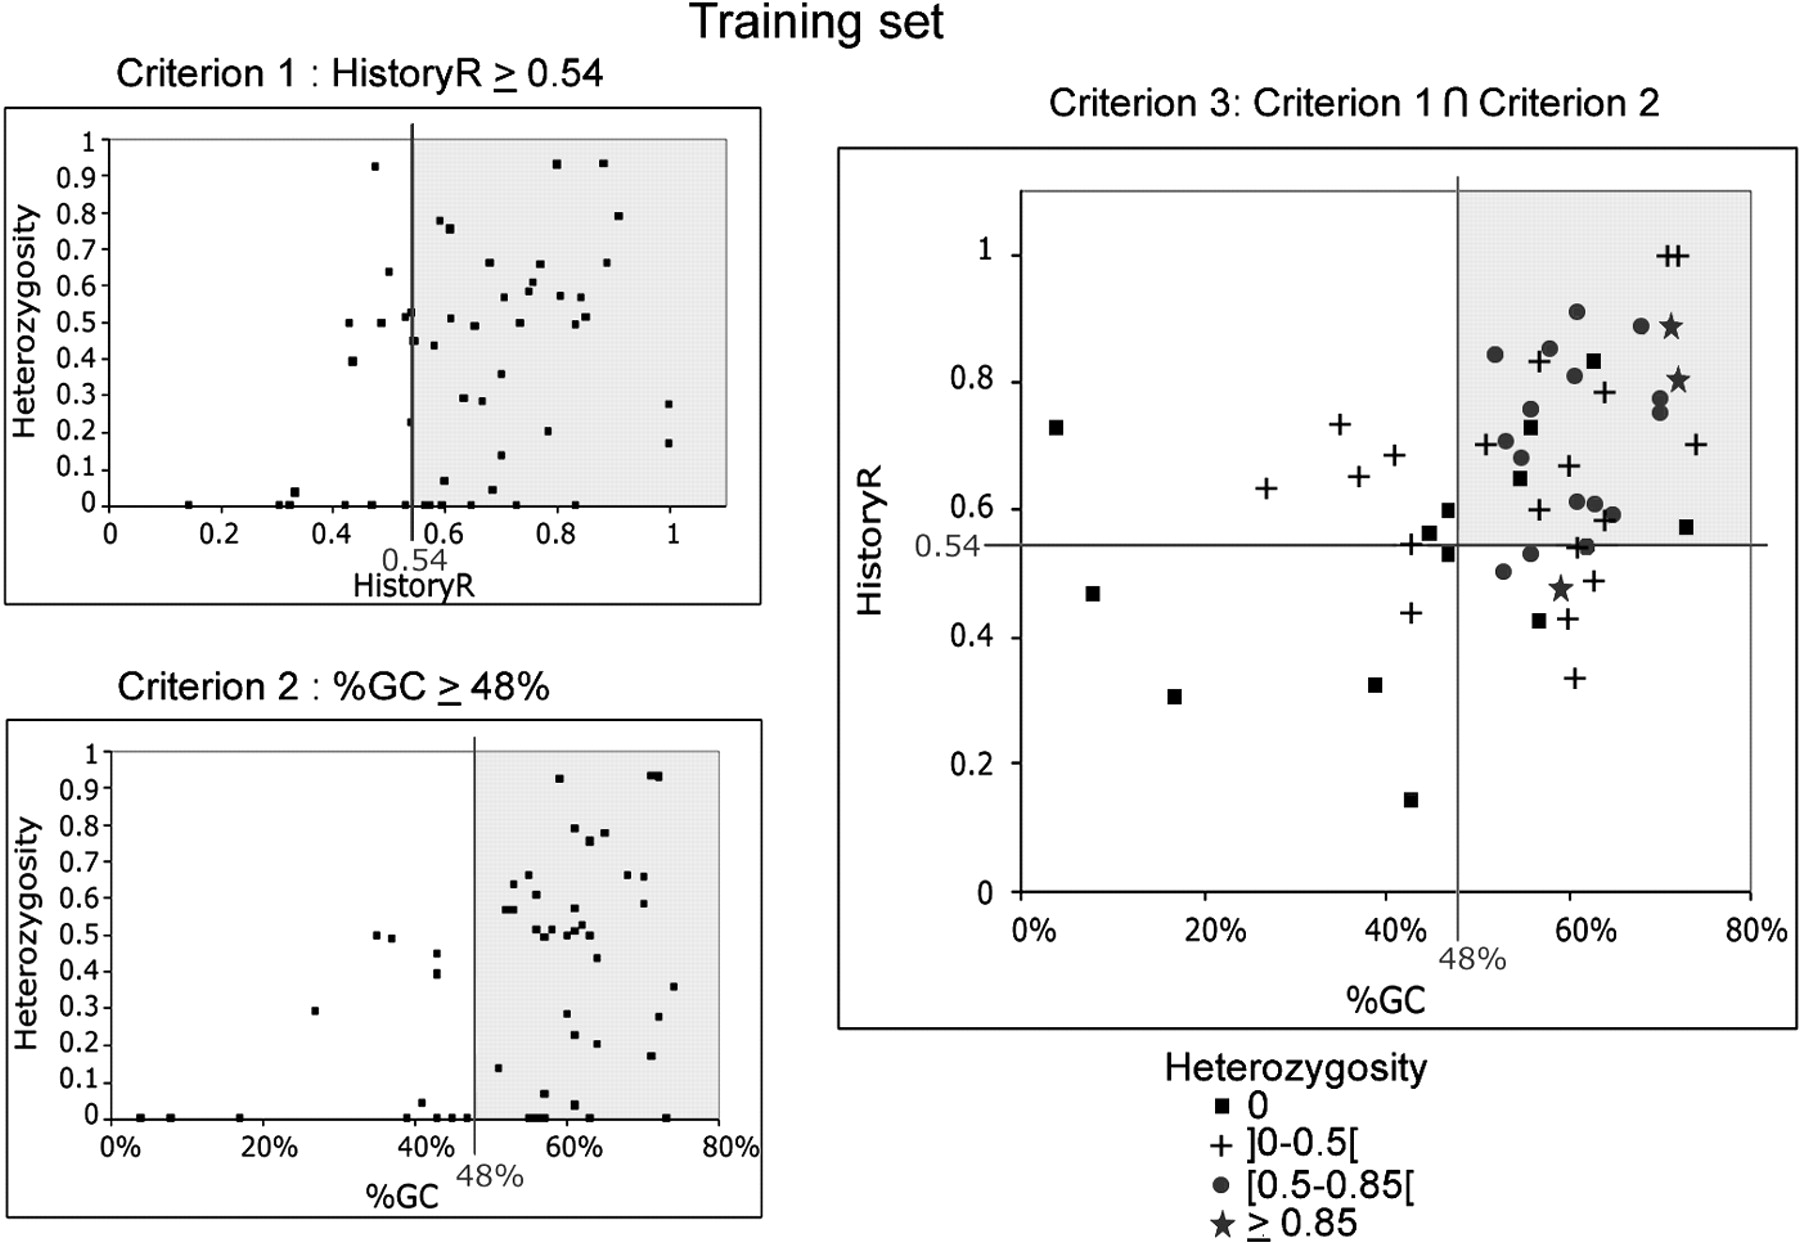
Figure 3.
Criteria 1, 2, and 3 applied to the training set. For criteria 1 and 2, heterozygosity (28 individuals) versus HistoryR (criterion 1) or percentage of GC (%GC; criterion 2) are plotted. Correlations are significant at the 0.01 level. For criterion 3, HistoryR versus %GC is plotted, with different symbols representing the polymorphism. Lines represent the selected thresholds, and shaded areas contain the minisatellites selected by the criteria (criterion 1, HistoryR ≥0.54; criterion 2, %GC ≥48%; criterion 3, criteria 1 and 2 combined). Plots show that criteria select most of the polymorphic minisatellites and eliminate a majority of monomorphs or slightly polymorphic ones.