Figure 5.
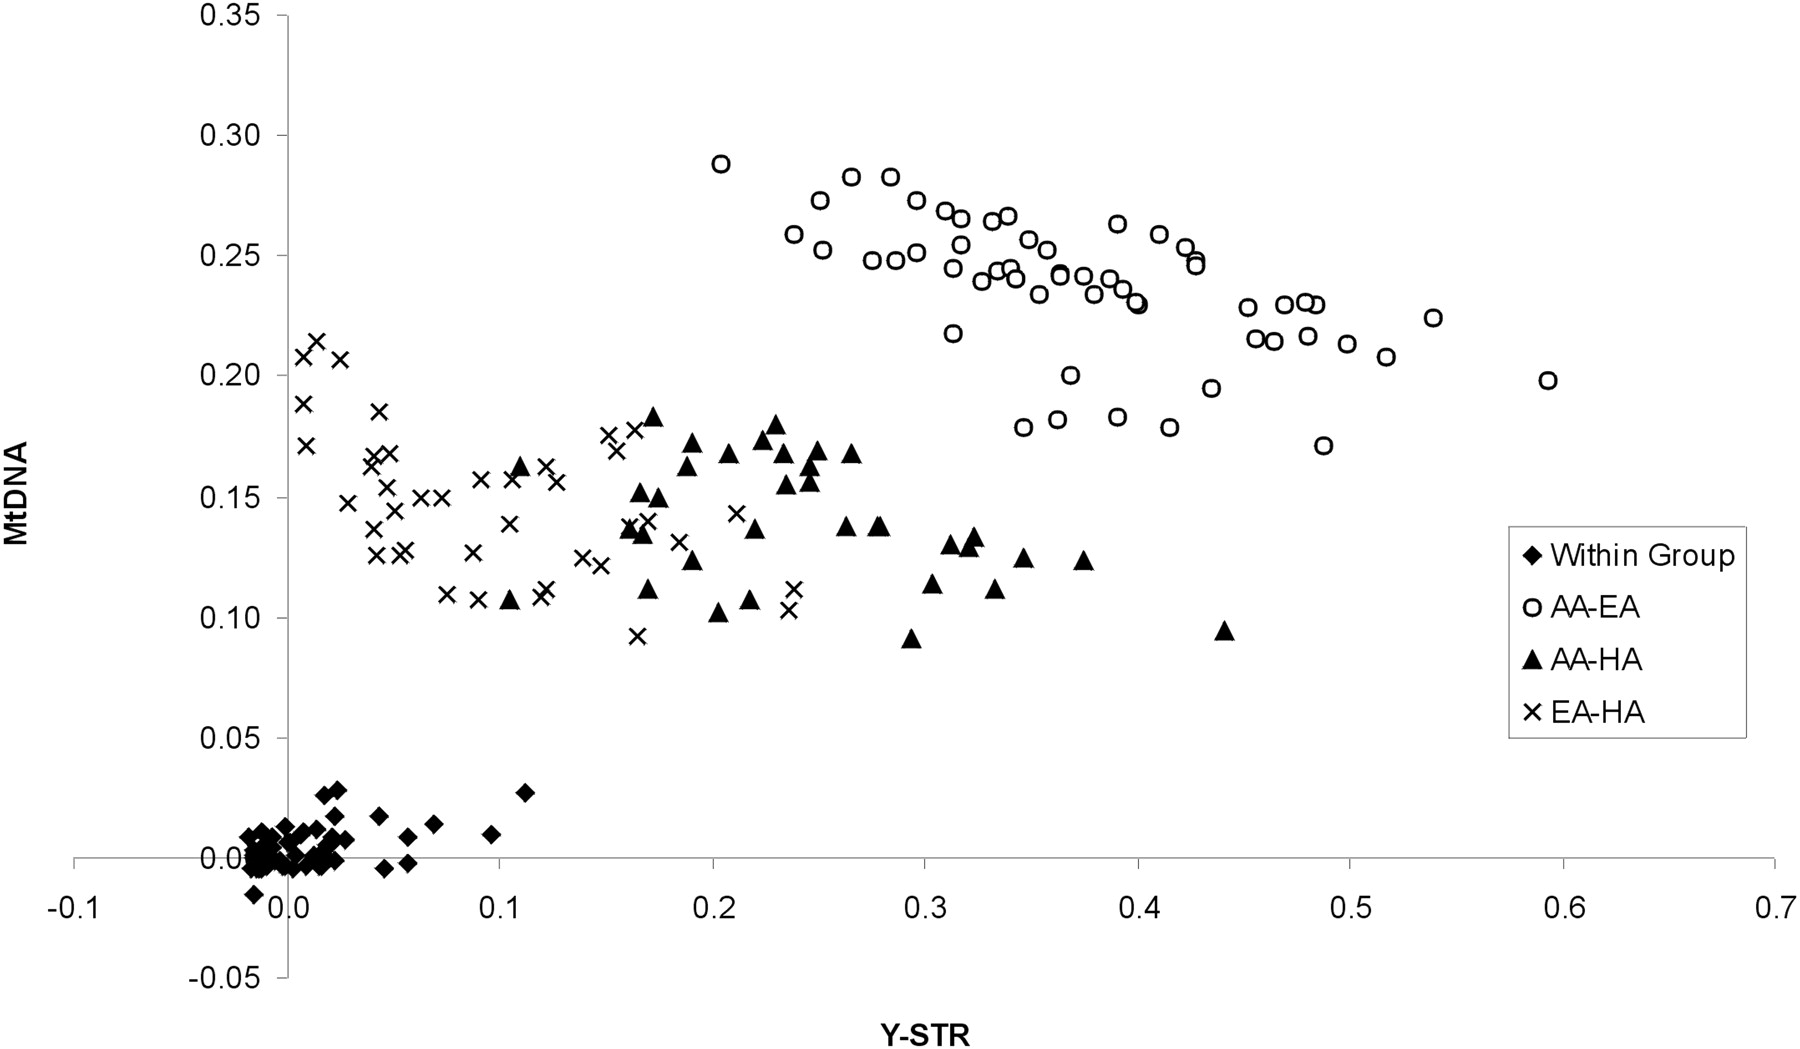
Plot of RST values for Y-STR haplotypes vs. FSTvalues for mtDNA SSO-types, for U.S. groups. (AA) African-American; (EA) European-American; (HA) Hispanic.
Plot of RST values for Y-STR haplotypes vs. FSTvalues for mtDNA SSO-types, for U.S. groups. (AA) African-American; (EA) European-American; (HA) Hispanic.