Figure 4.
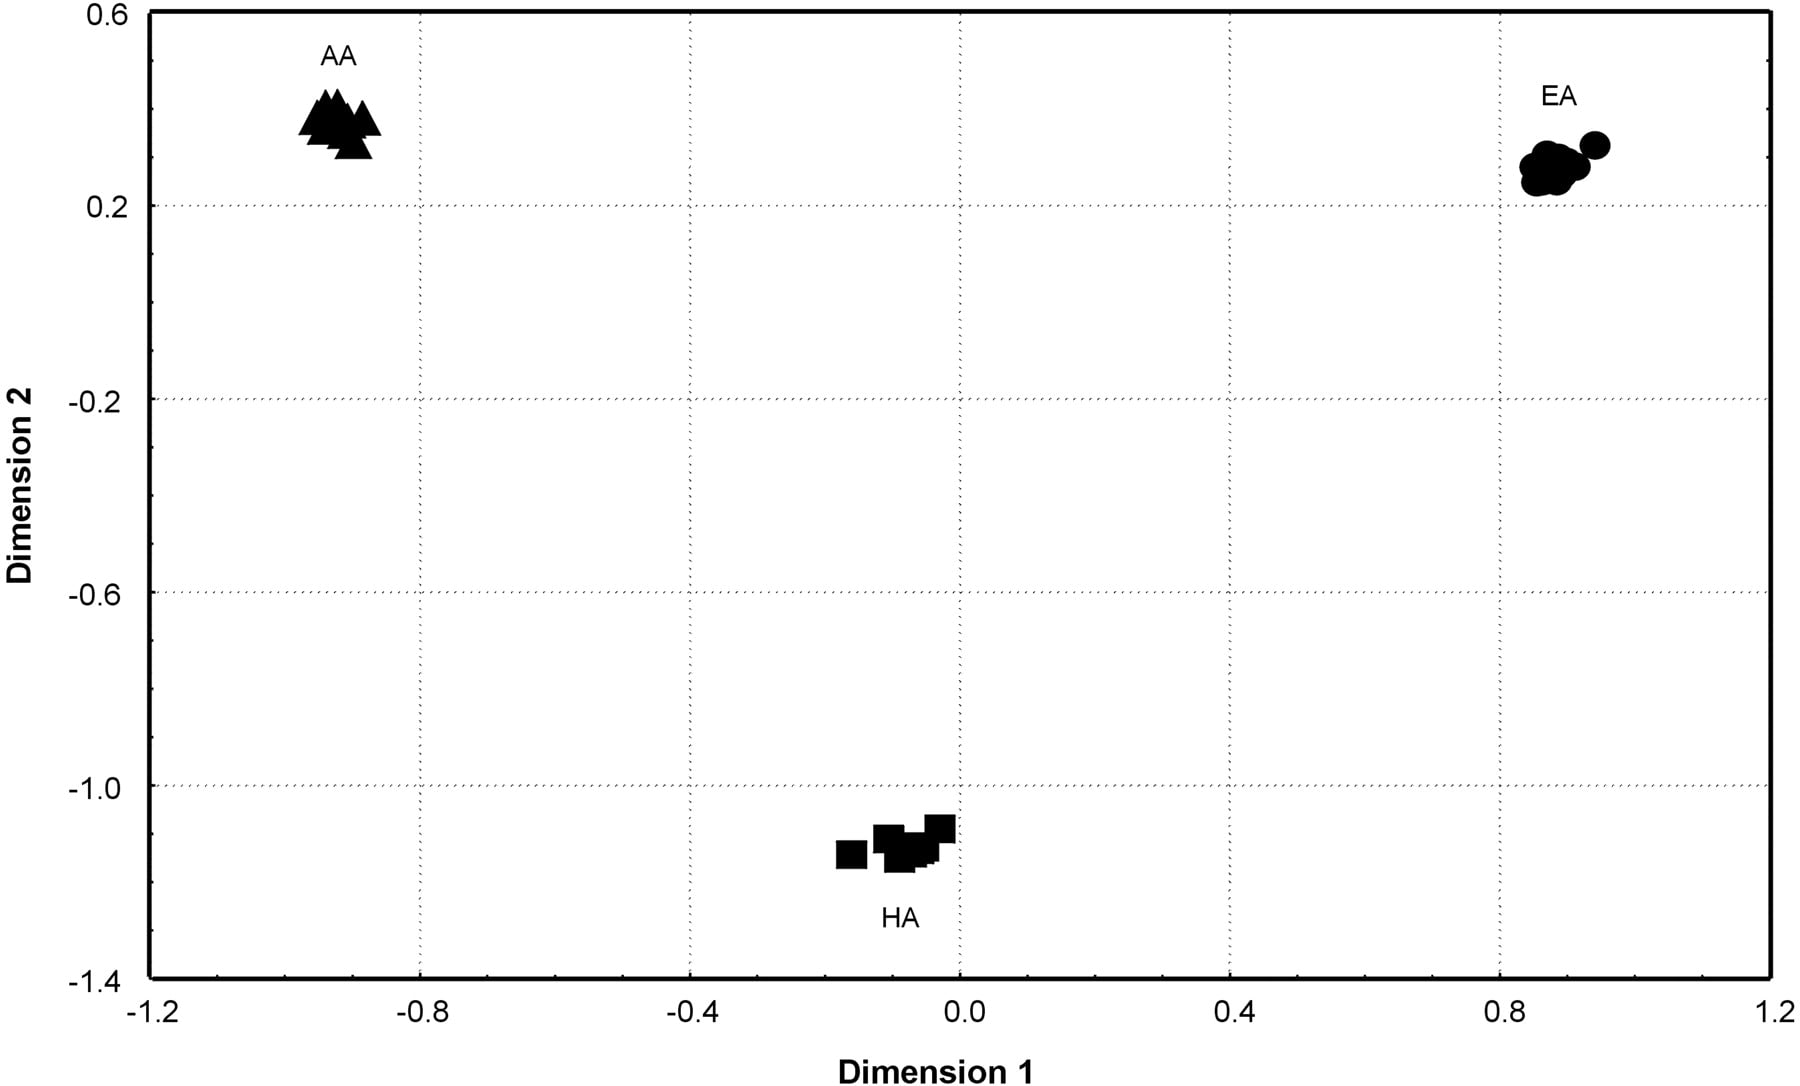
MDS plot on the basis of FST values for mtDNA SSO-types for U.S. groups. (▴) African-Americans (AA); (●) European-Americans (EA); (▪) Hispanics (HA).
MDS plot on the basis of FST values for mtDNA SSO-types for U.S. groups. (▴) African-Americans (AA); (●) European-Americans (EA); (▪) Hispanics (HA).