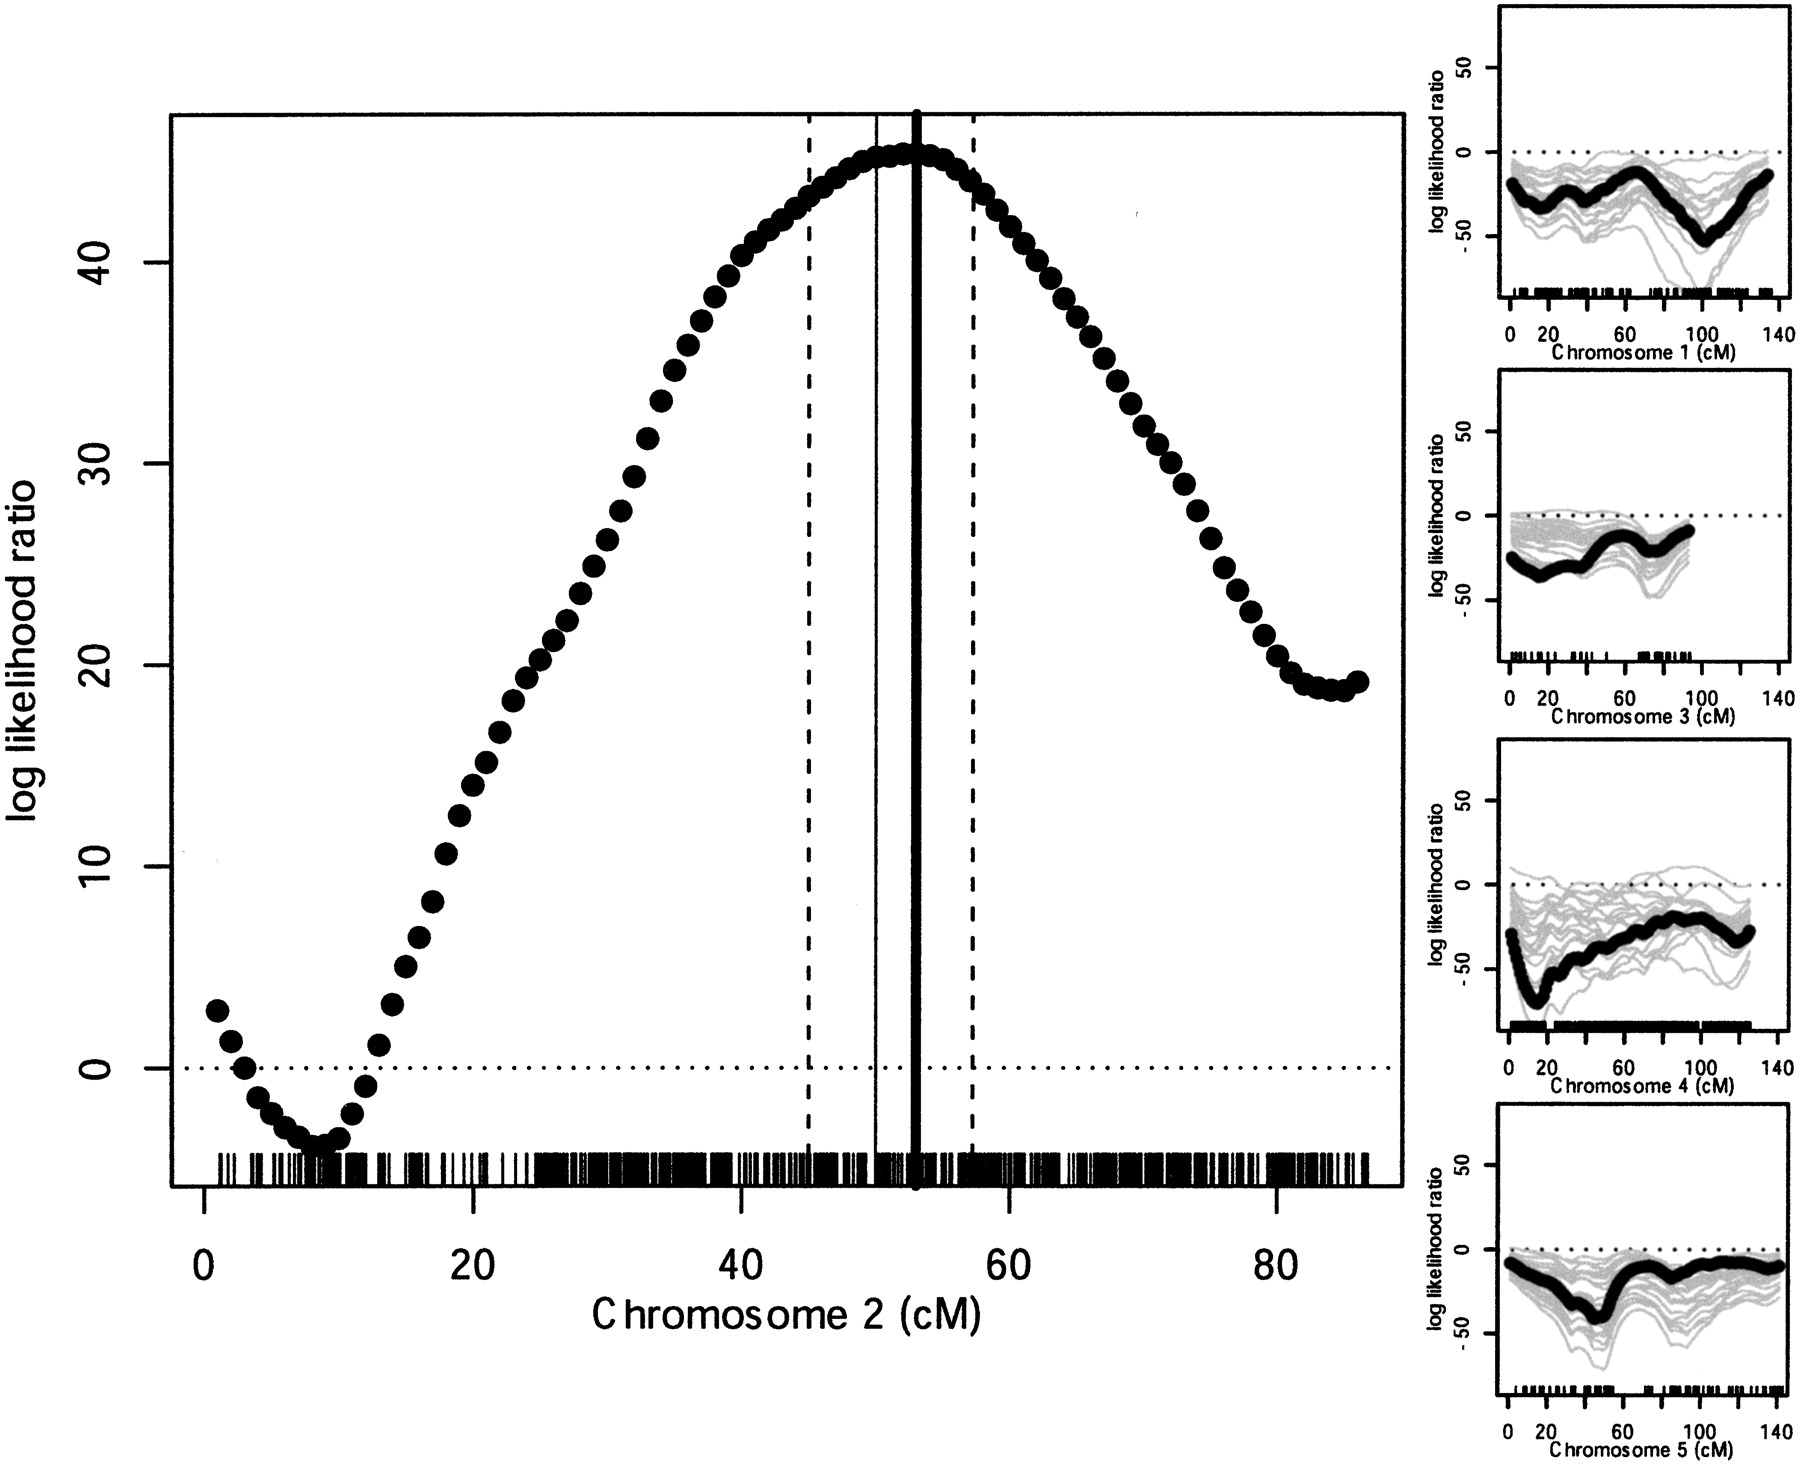
Figure 5.
Bulk segregant analysis. Hybridization of F2 pools was used to determine the predicted location of the erecta mutation. (Left) Solid circles show the LLR statistic at each cM. The maximum LLR (thick vertical line), is 3 cM away from theERECTA gene (thin vertical line) on chromosome 2. Simulations were used to determine that the 95% confidence interval spanned 12 cM (dashed vertical lines). LLR scores on unlinked chromosomes (black solid circles). Most LLR scores are negative on unlinked chromosomes. Gray lines show the variation in LLR scores produced by simulations.