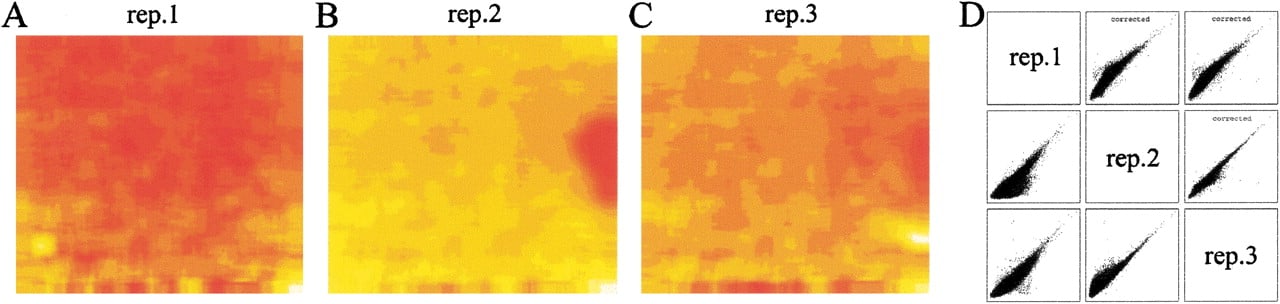
Figure 1.
Spatial correction of hybridization signals. The spatial correction applied to three replicate arrays is shown in false color (A–C). Some prominent spatial artifacts can be seen. Pairwise scatter plots (D) compare the log intensity of each feature between replicate arrays. Before spatial correction (bottom left three scatter plots), a shoulder can be seen mainly due to the large smudge on rep.2. After spatial correction (top rightthree scatter plots), this shoulder is almost completely removed, increasing the replicate correlation.