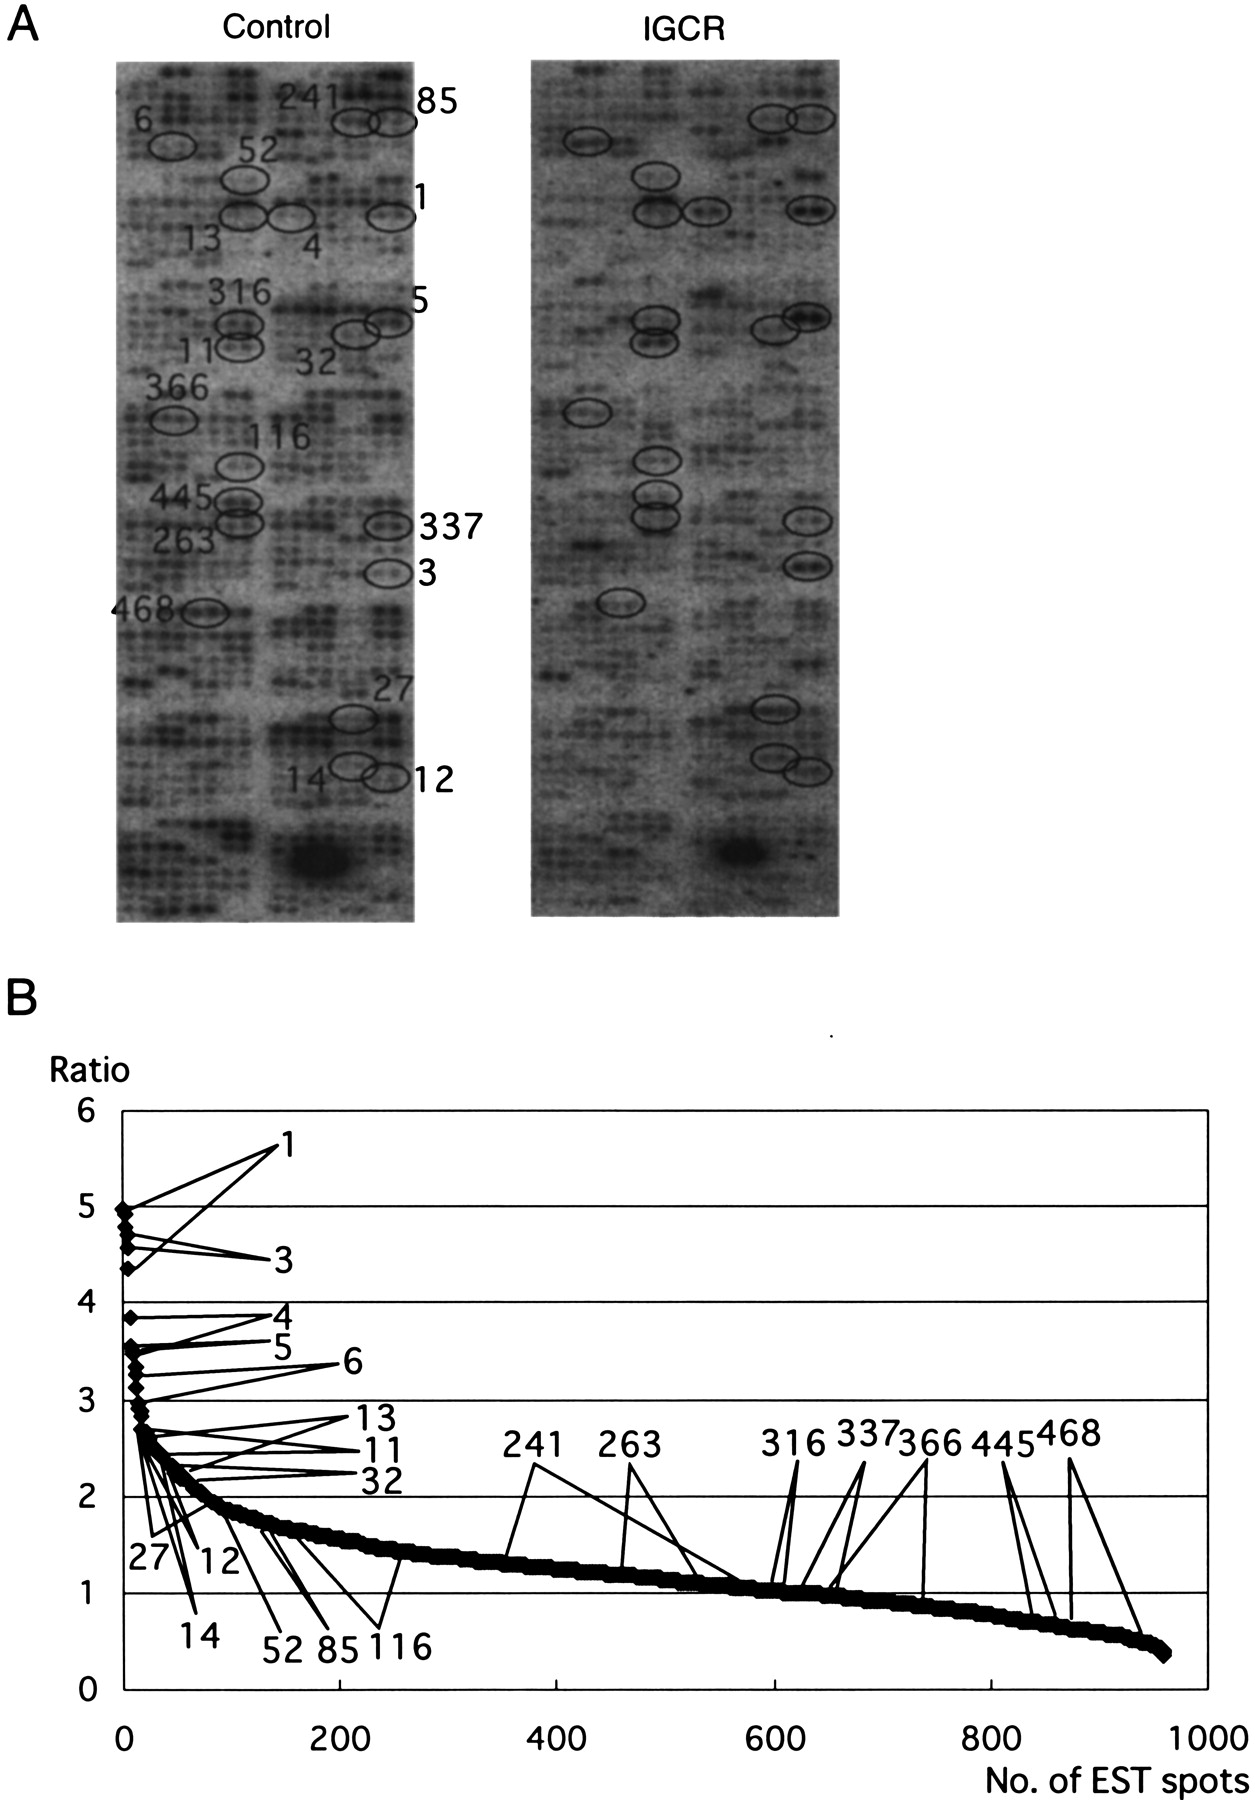
Figure 3.
Screening of gene-associated restriction fragment length polymorphism (RFLP) fragments by EST macroarray. (A) Radioactive images of an EST macroarray after hybridization. (Left panel) Probed with the control DNA sample. (Right panel) Probed with the IGCR DNA sample. (B) Ratios (IGCR/control) of signal intensities at each spot were calculated (averaged from duplicate samples), re-numbered from 1 (the highest) to 480 (the lowest) and plotted in that order.