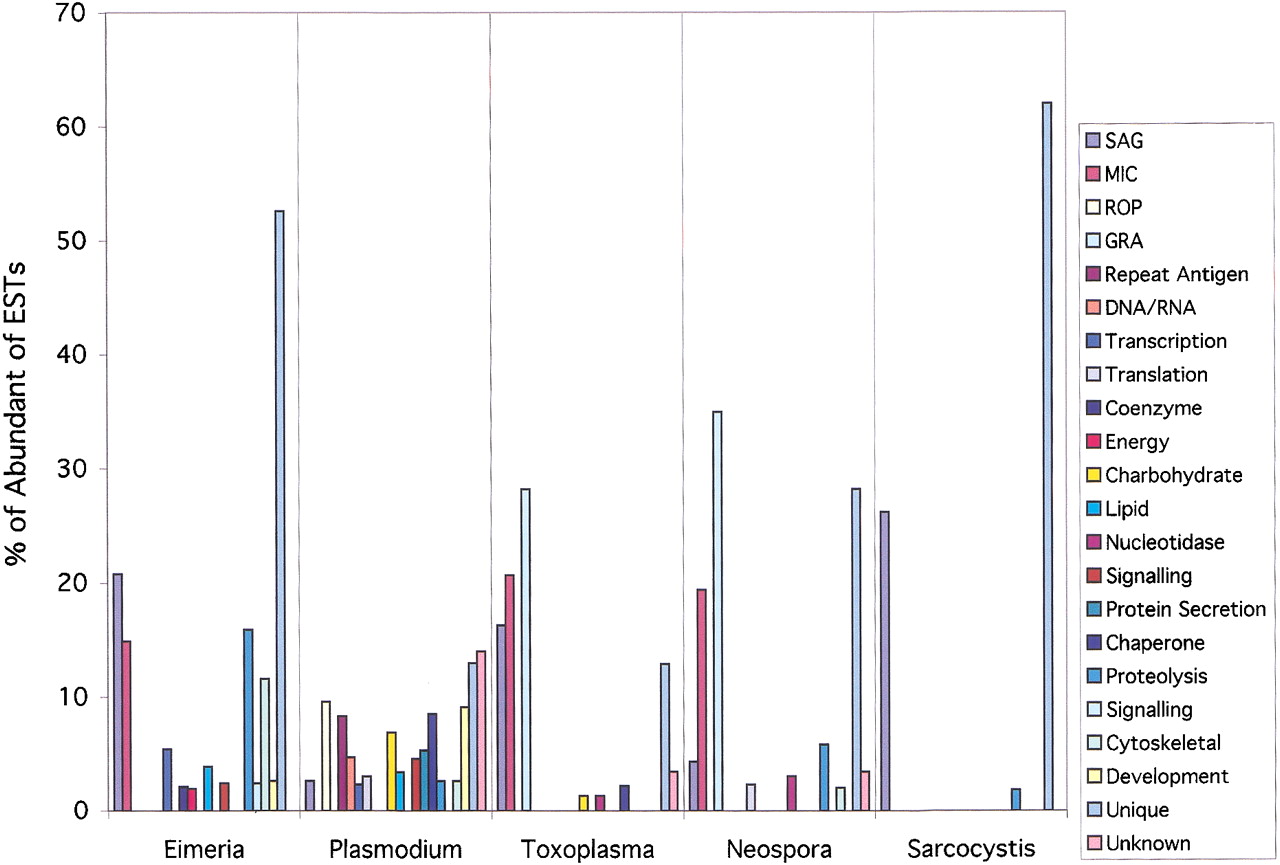
Figure 4.
Most abundant 25 assemblies for each organism. Data are plotted as number of all ESTs contained within a particular category for each of the top 25 assemblies. Functional groupings were assigned using the categories established for the COGs database with the addition of categories for surface antigens (SAG), and secretory proteins from the micronemes (MIC), rhoptries (ROP), and dense granules (GRA).