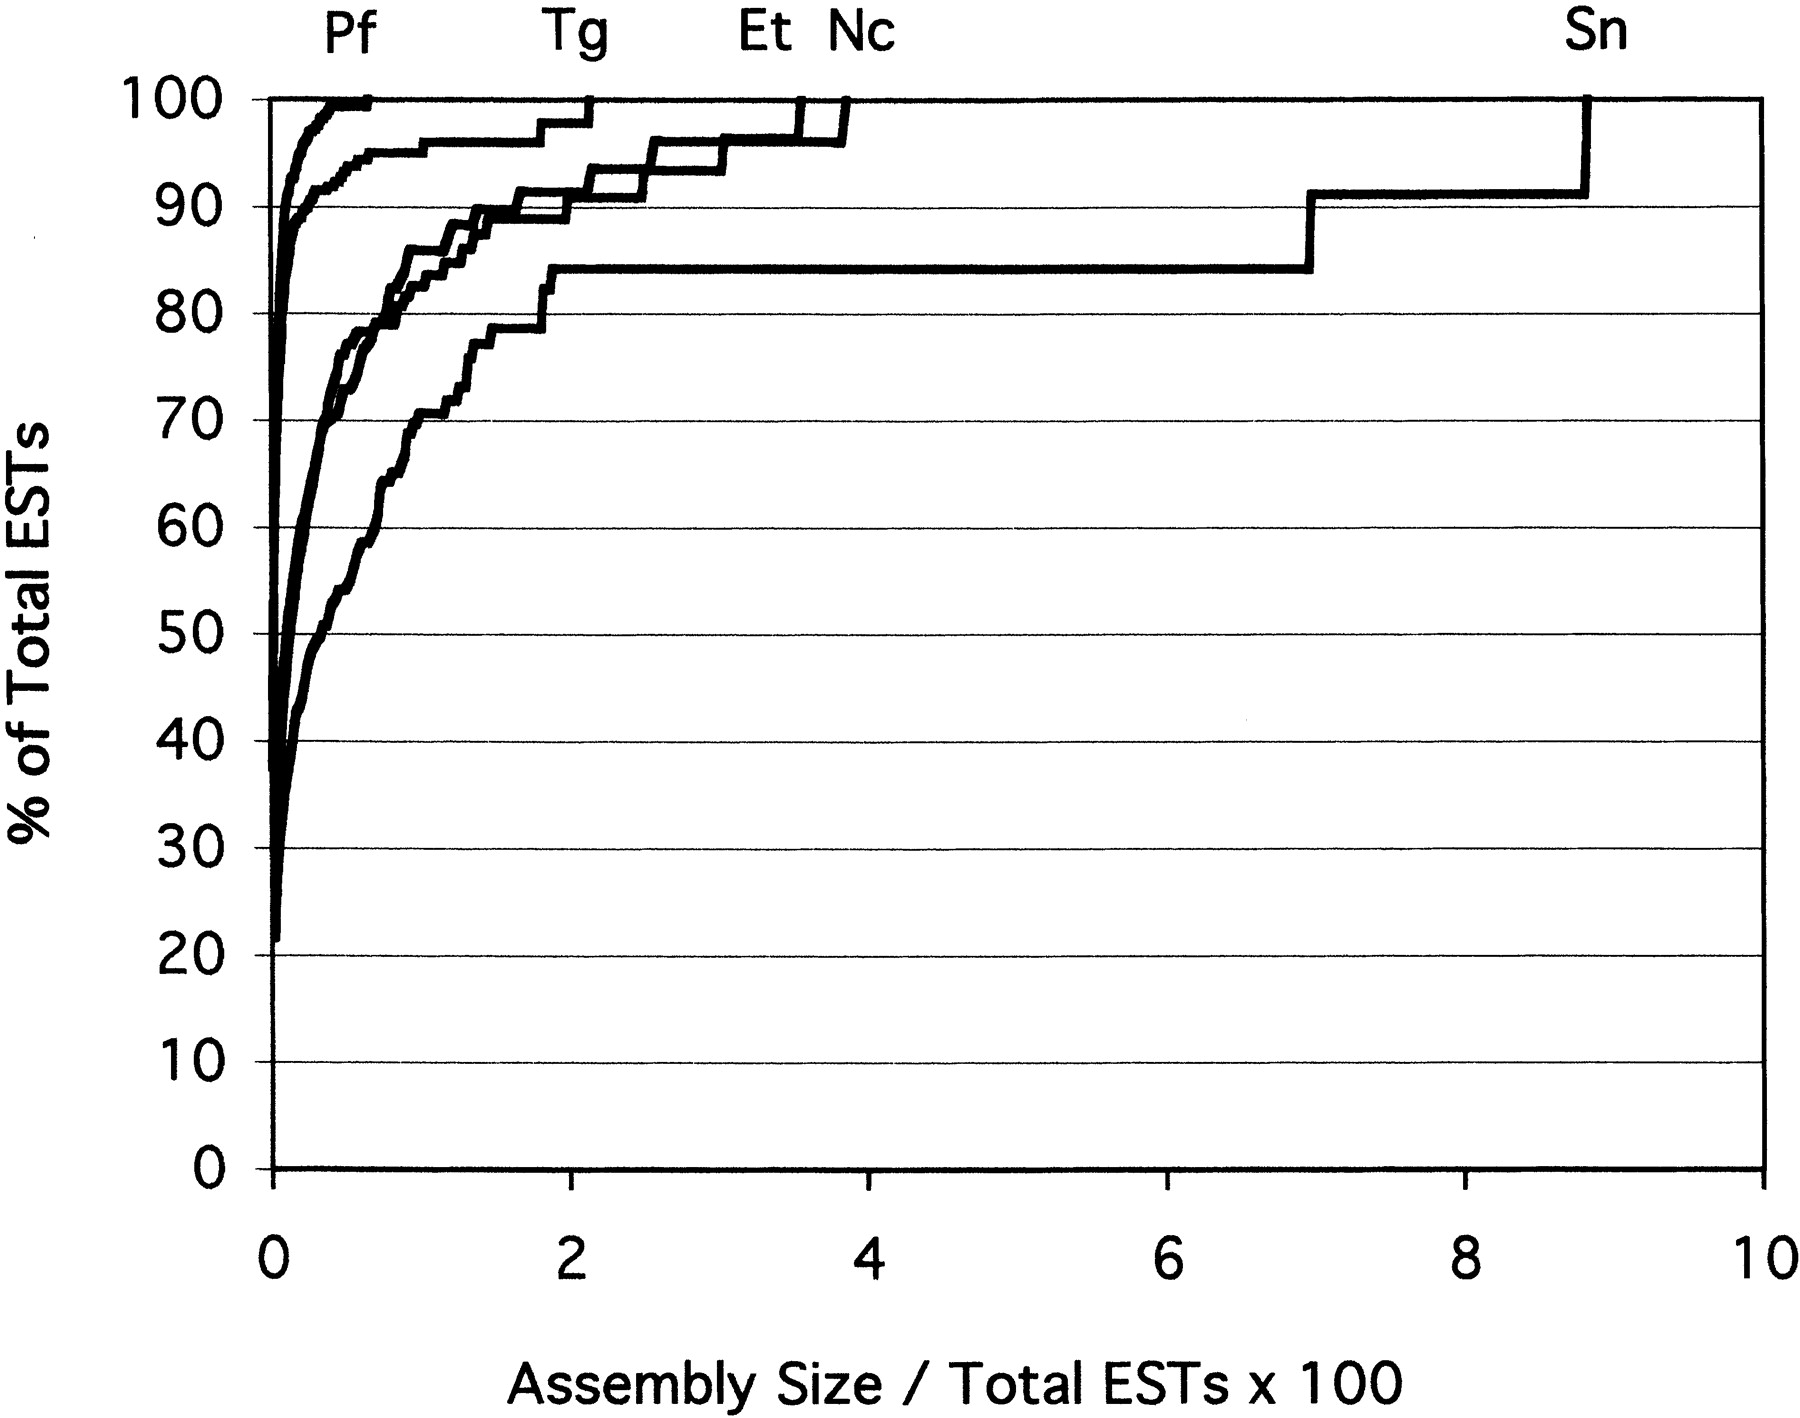
Figure 3.
Redundancy of apicomplexan ESTs. The percentage of the total ESTs (plotted on the Y-axis) is plotted as a function of increasing assembly sizes (expressed as a percentage of total ESTs on theX-axis). Significantly greater redundancy was observed inNeospora caninum (Nc), Eimeria tenella (Et), andSarcocystis neurona (Sn) relative to Toxoplasma gondii(Tg) and Plasmodium falciparum (Pf). The normalized cluster size of EST assemblies was determined by comparing the number of ESTs within each assembly to the total number of ESTs for that organism.