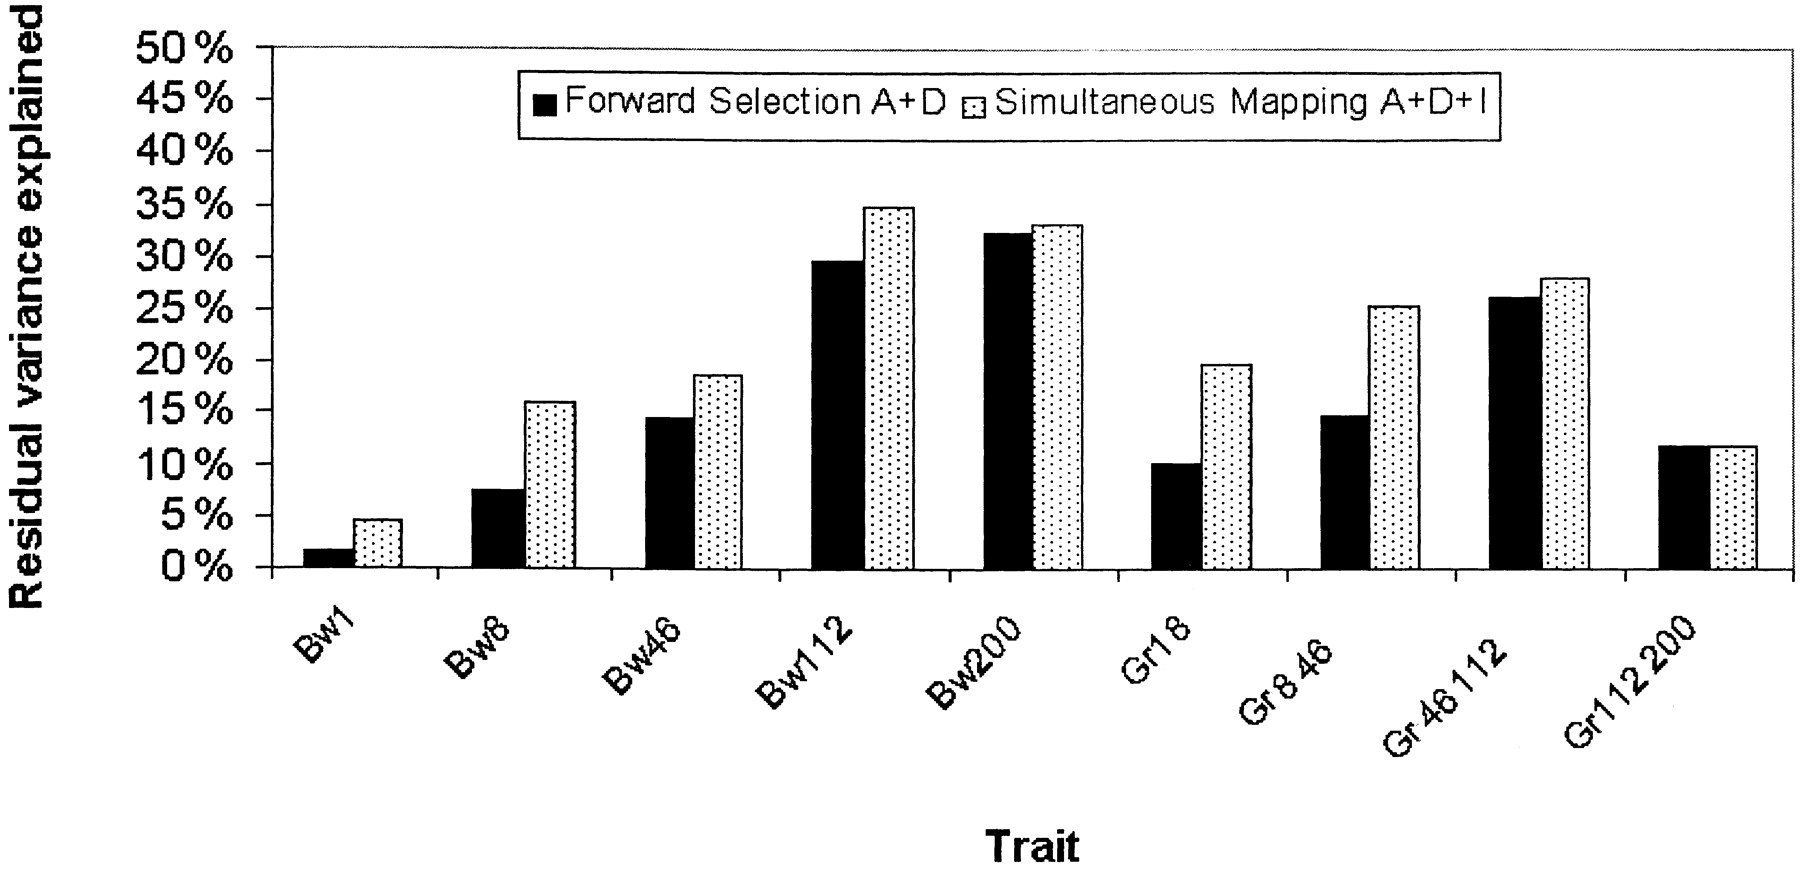
Figure 4.
The residual variance explained by the marginal effects of the quantitative trait loci (QTL) mapped using forward selection and by the marginal and epistatic effects of the QTL mapped by SIM at a 5% genome-wide significance level. A, additive effect; D, dominance effect; I, interaction; Bw1, body weight at day 1; Bw8, body weight at day 8; Bw46, body weight at day 46; Bw112, body weight at day 112; Bw200, body weight at day 200; Gr18, growth from day 1 to day 8; Gr846, growth from day 8 to day 46; Gr46112, growth from day 46 to day 112; Gr112200, growth from day 112 to day 200.