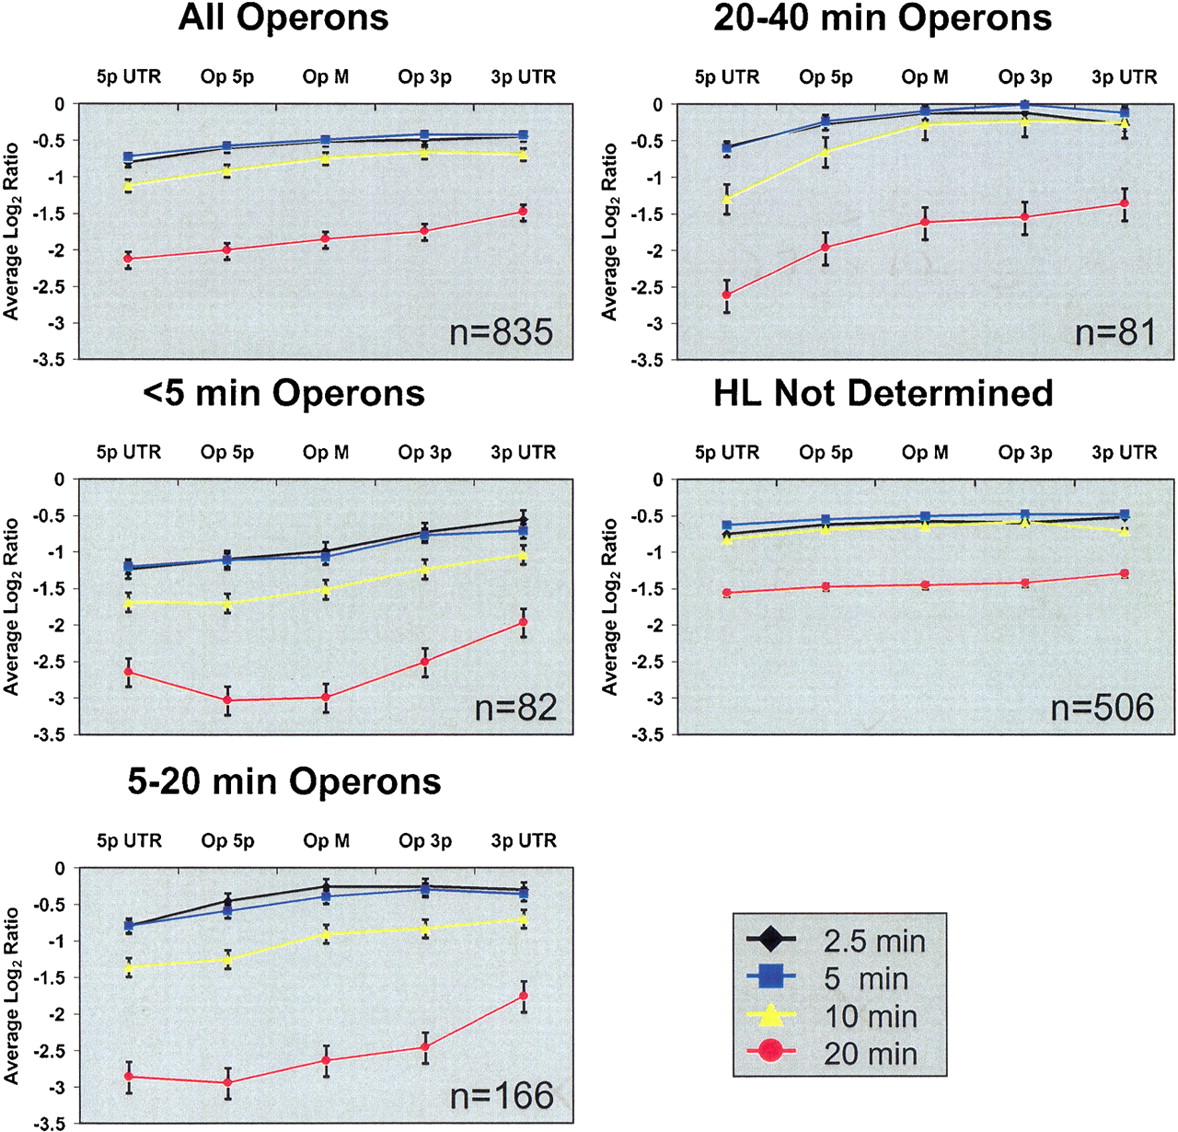
Positional differences in operon degradation. Operon regions are plotted on the x-axis, and average log2 ratios (compared to the 0 min timepoint) are plotted on the y-axis. Vertical bars indicate standard error. Operons were divided into five regions: 30 bases upstream (5p UTR) and downstream (3p UTR), and three equal-length regions of the coding region: 5 prime (Op 5p), middle (Op M), and 3 prime (Op 3p). Patterns of operons with different average half-lives were compared. A 5′ to 3′ directionality is observable in the coding regions of all operon subsets. This directionality generally extends at least 30 bases into the UTRs, although the 5′ UTR of quickly degrading operons (<5 min) seems to be more stable than the coding region. All curves in this figure have significant variation between means by one-way ANOVA at α = 0.001, with the following exceptions: 2.5 min of the ‘20–40 min’ graph, and the 5- and 20-min curves of the ‘half-life not determined’ graph, which were significant at α = 0.05, 0.05, and 0.10, respectively. P-values for timepoints on the ‘all operons’ graph were all below 1×10⁻¹².