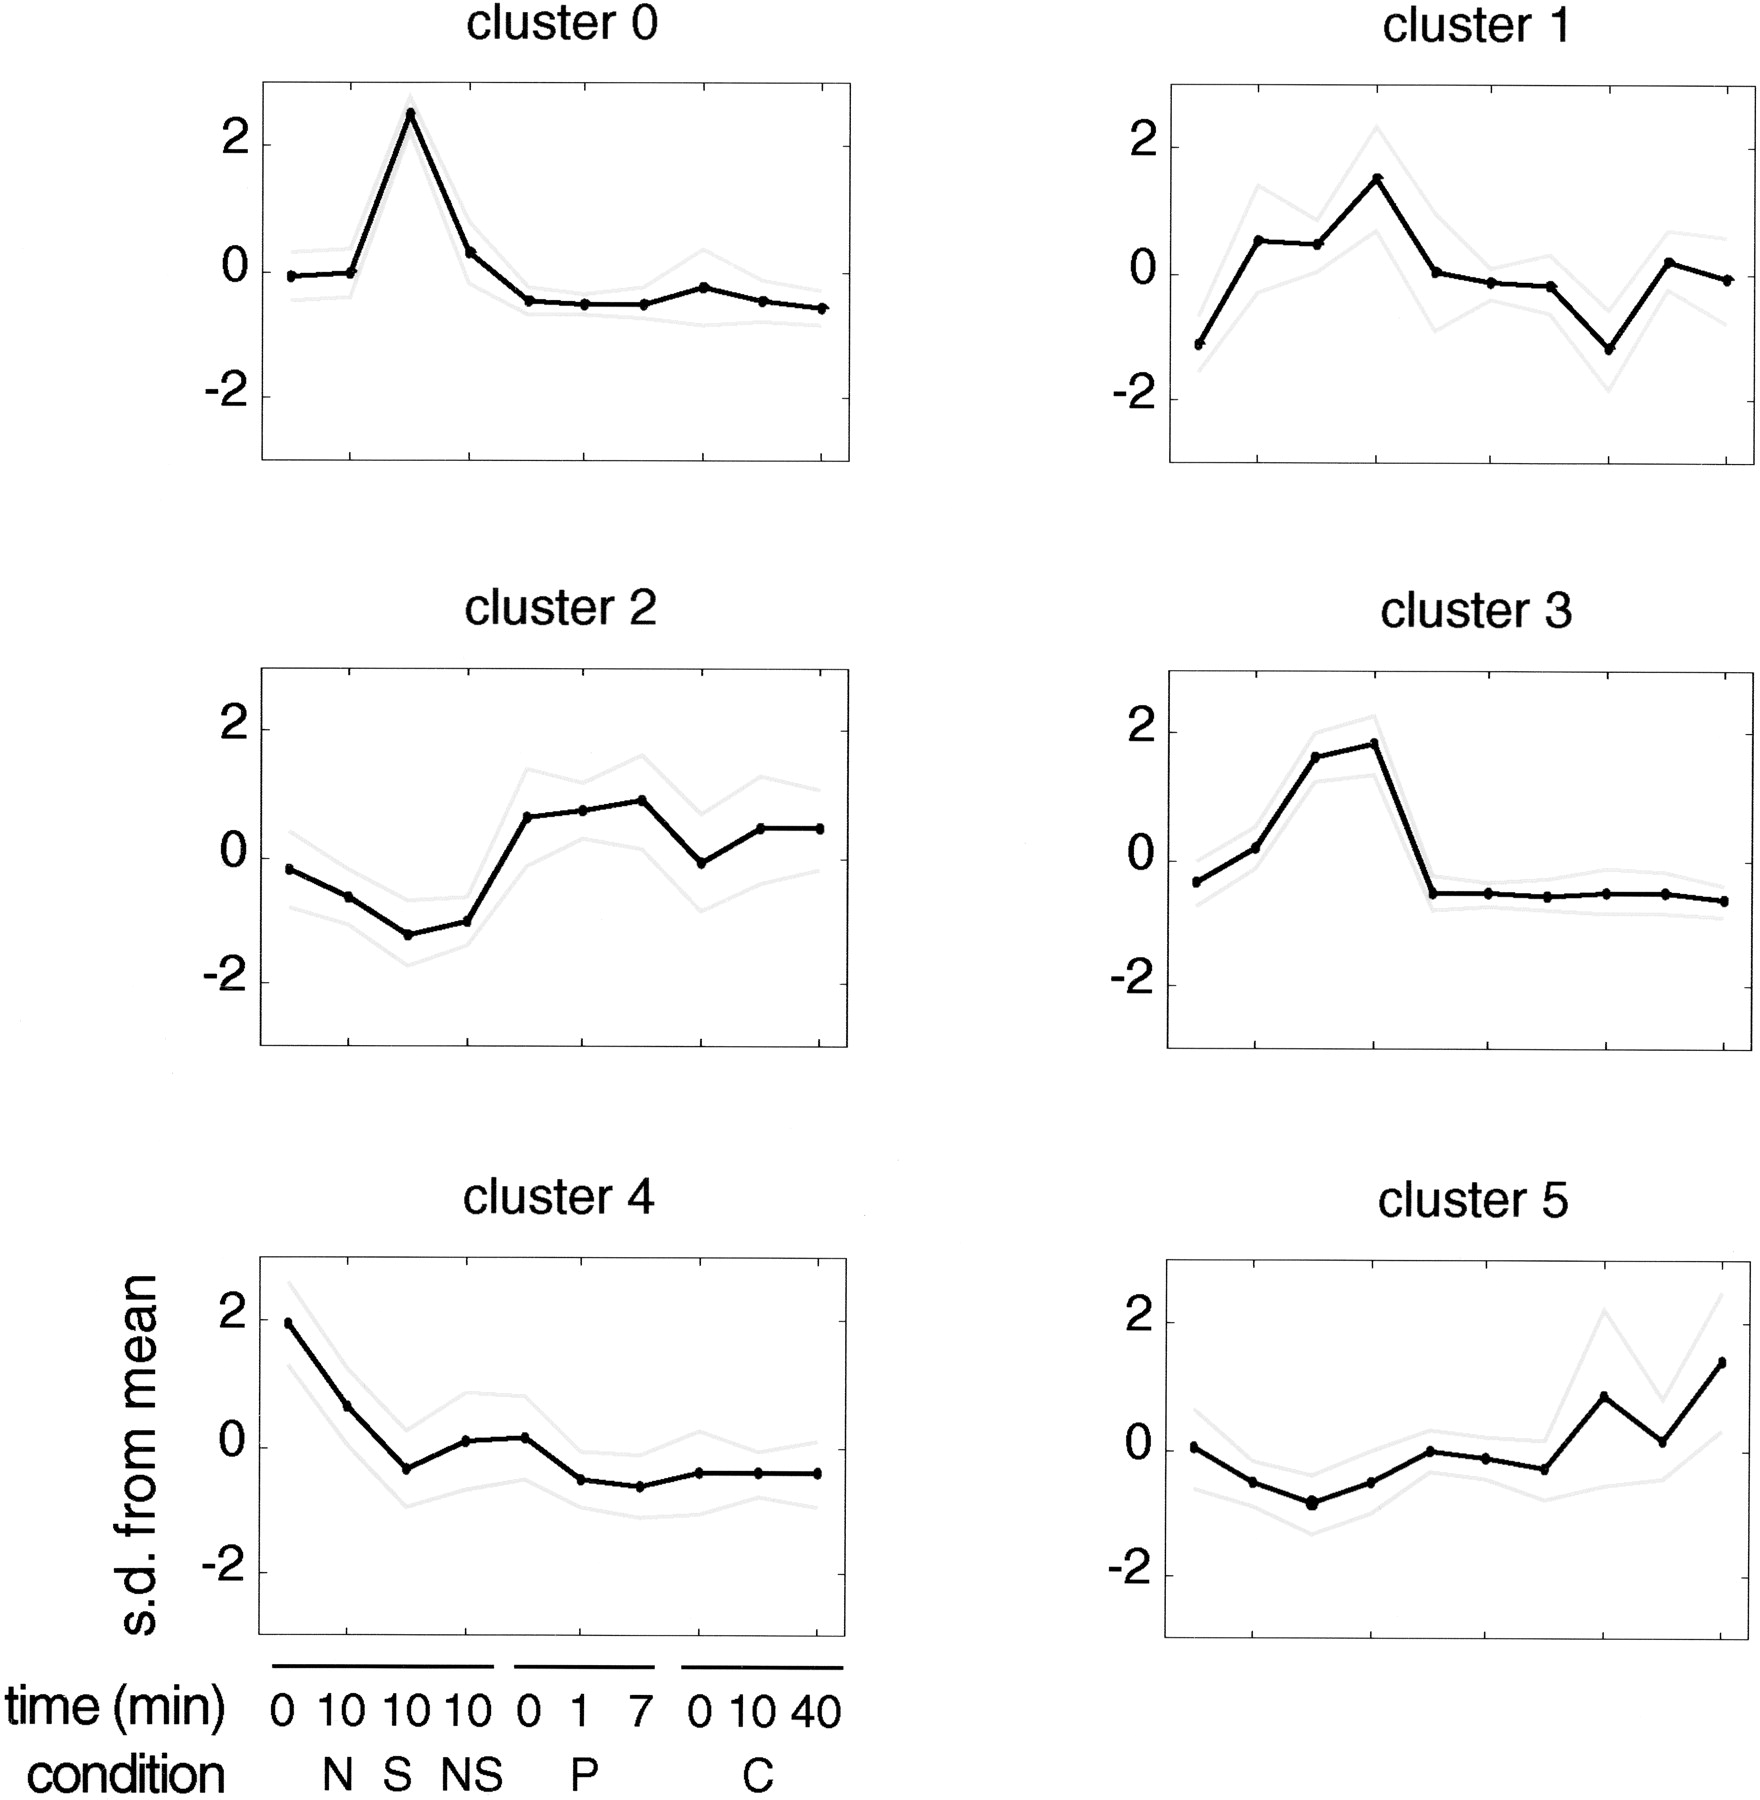
Figure 2.
The osmotic stress response partitions into distinct clusters of drug sensitivity. Mean-variance normalized expression profiles for the 175 genes changed greater than twofold with salt treatment were partitioned into six clusters using self-organizing maps. The black line denotes the mean expression profile of the cluster, and the gray lines indicate one standard deviation above and below this mean (N) Novobiocin; (S) salt; (NS) novobiocin + salt; (P) pefloxacin; (C) chloramphenicol.