Skip to main content
Figure 4
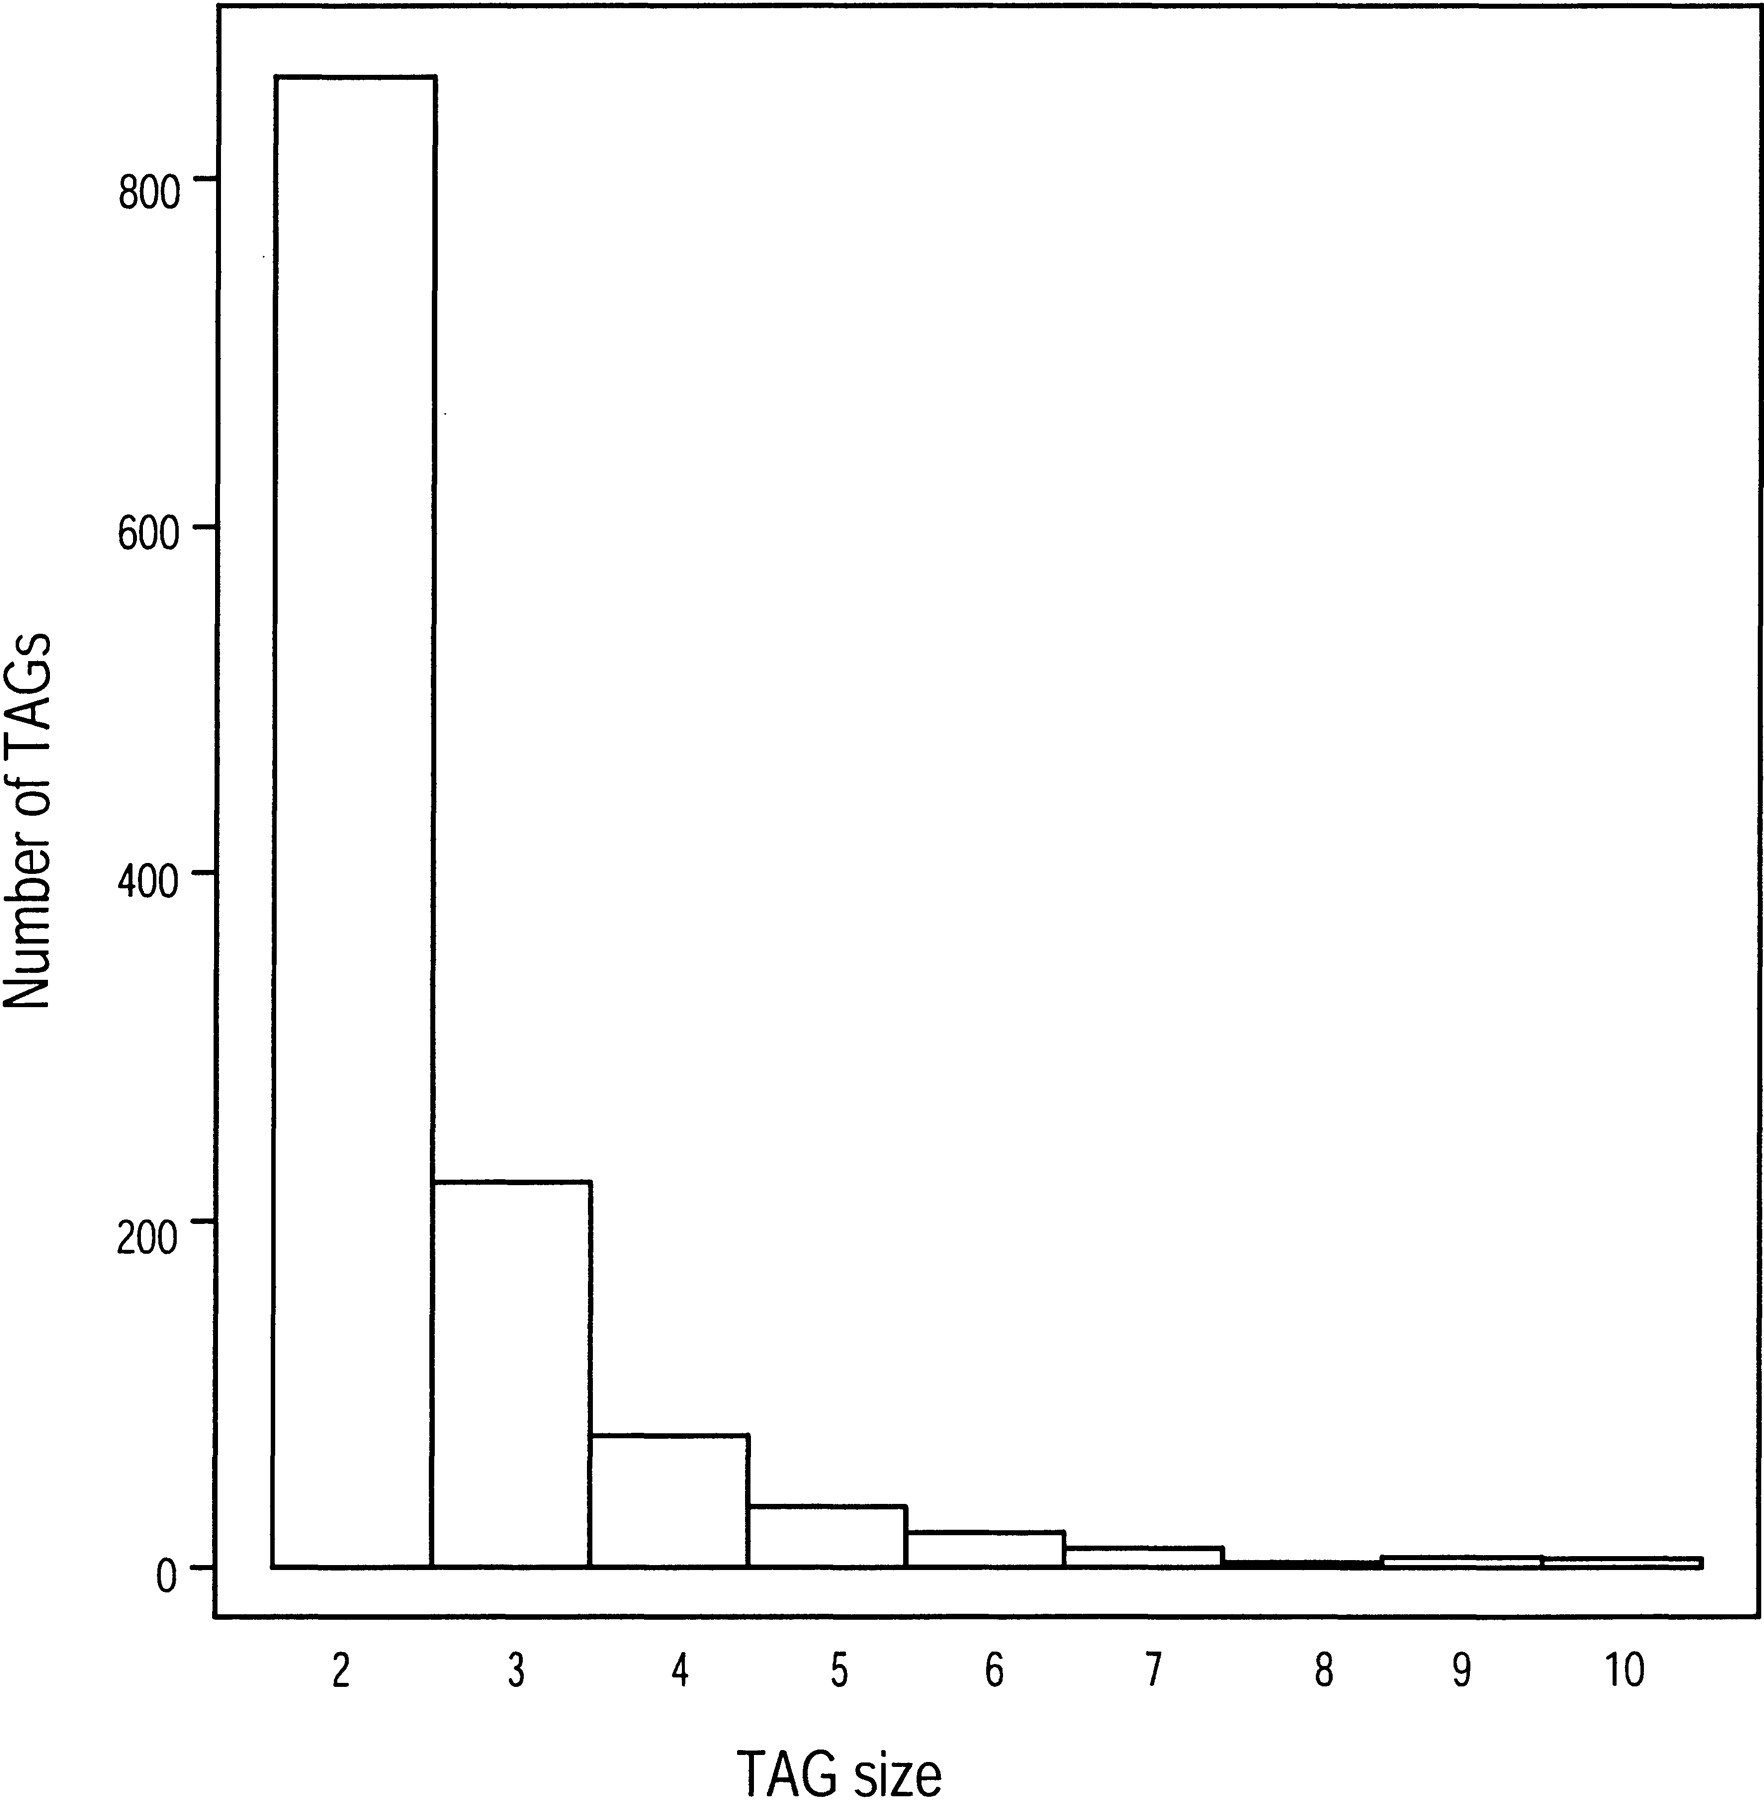
The distribution of the number of genes in a TAG for the data set with E-value 10
-30
and no spacer.