Skip to main content
Figure 4
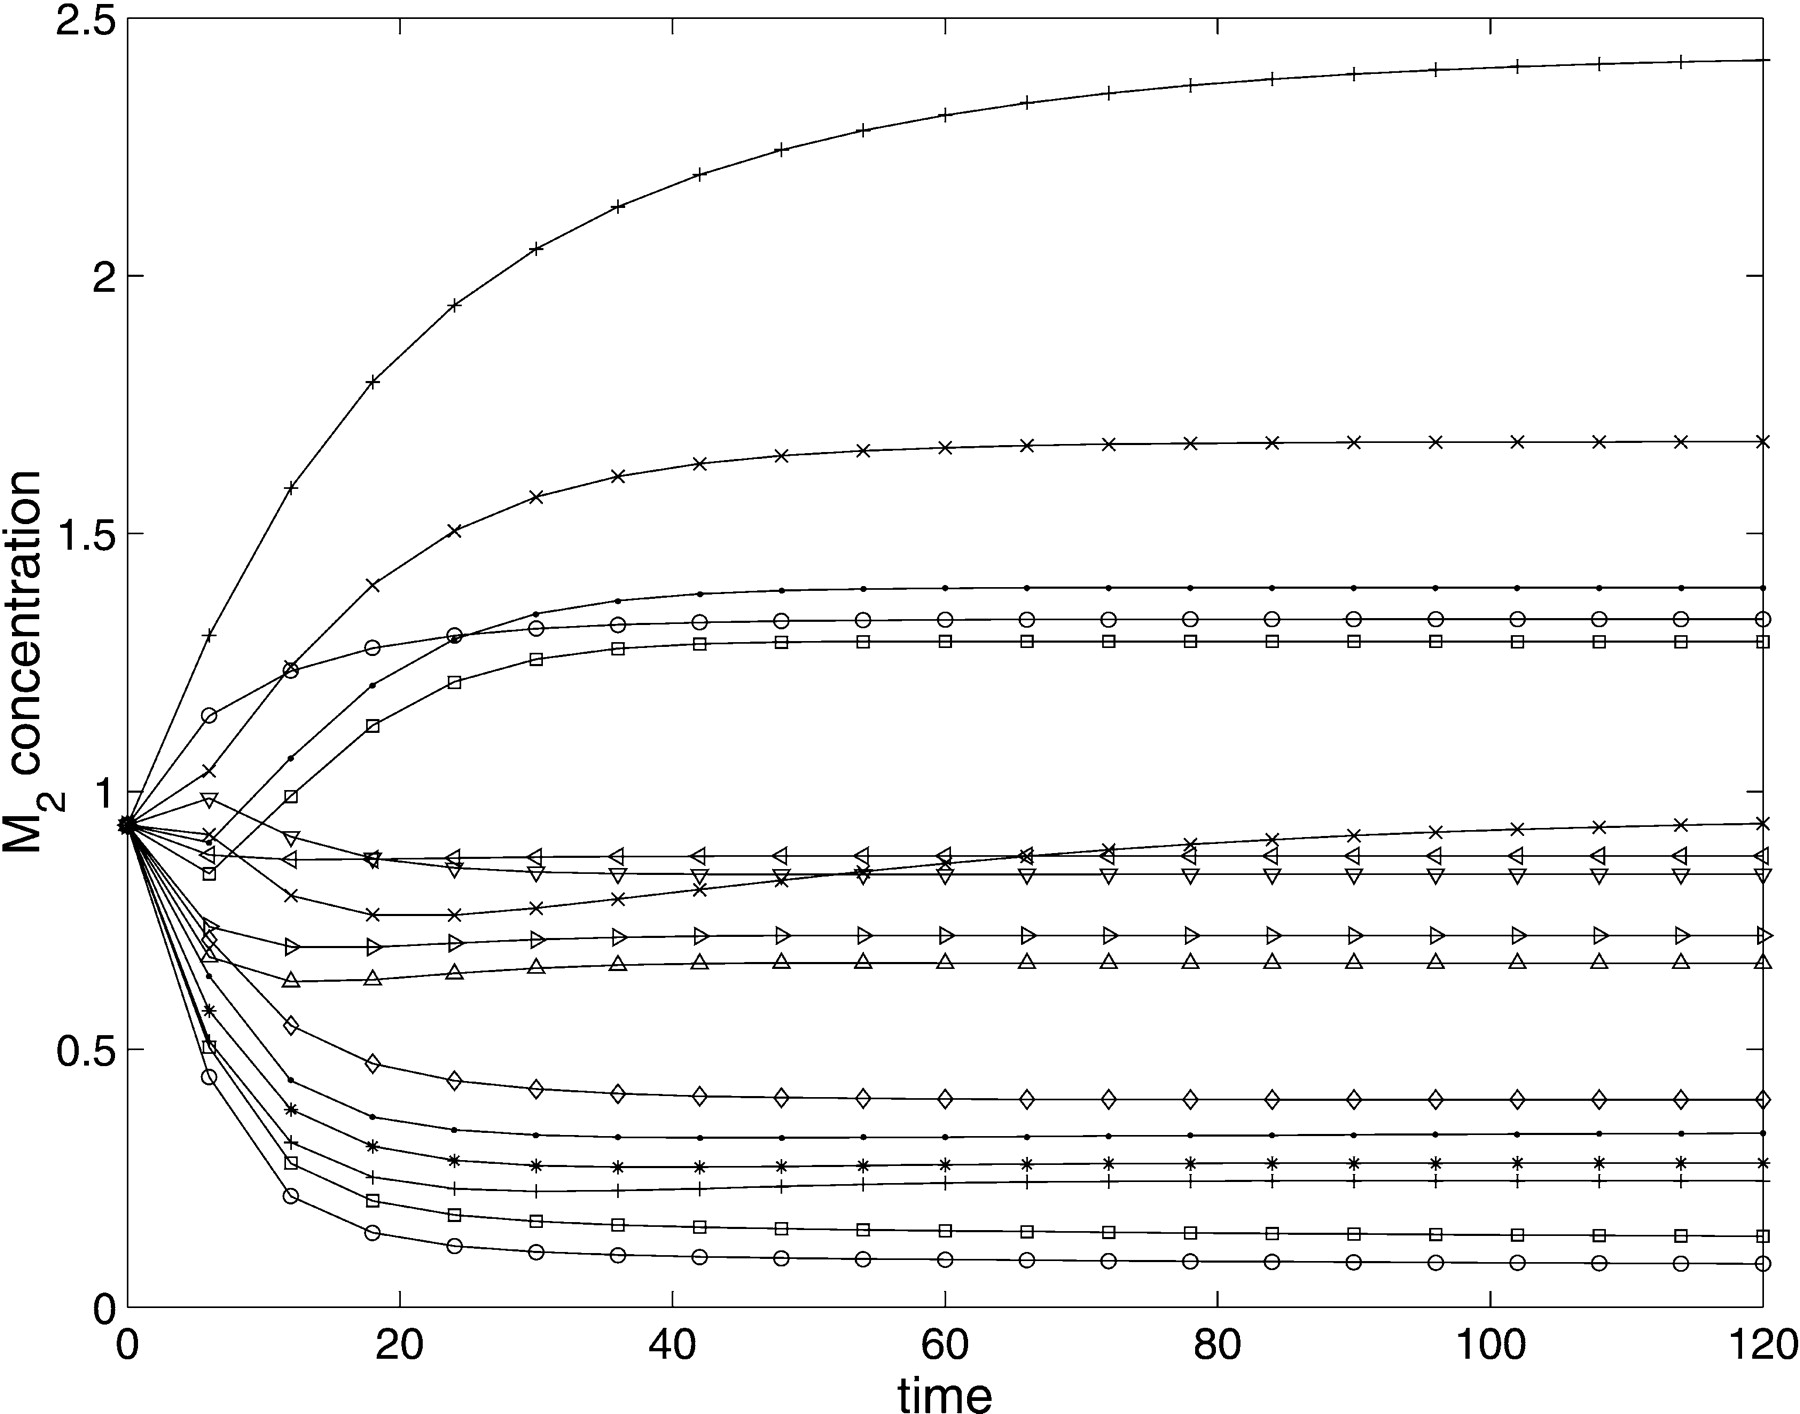
M
2
predicted (continuous line) and experimental (marker) behavior for the 16 experiments.