Figure 1
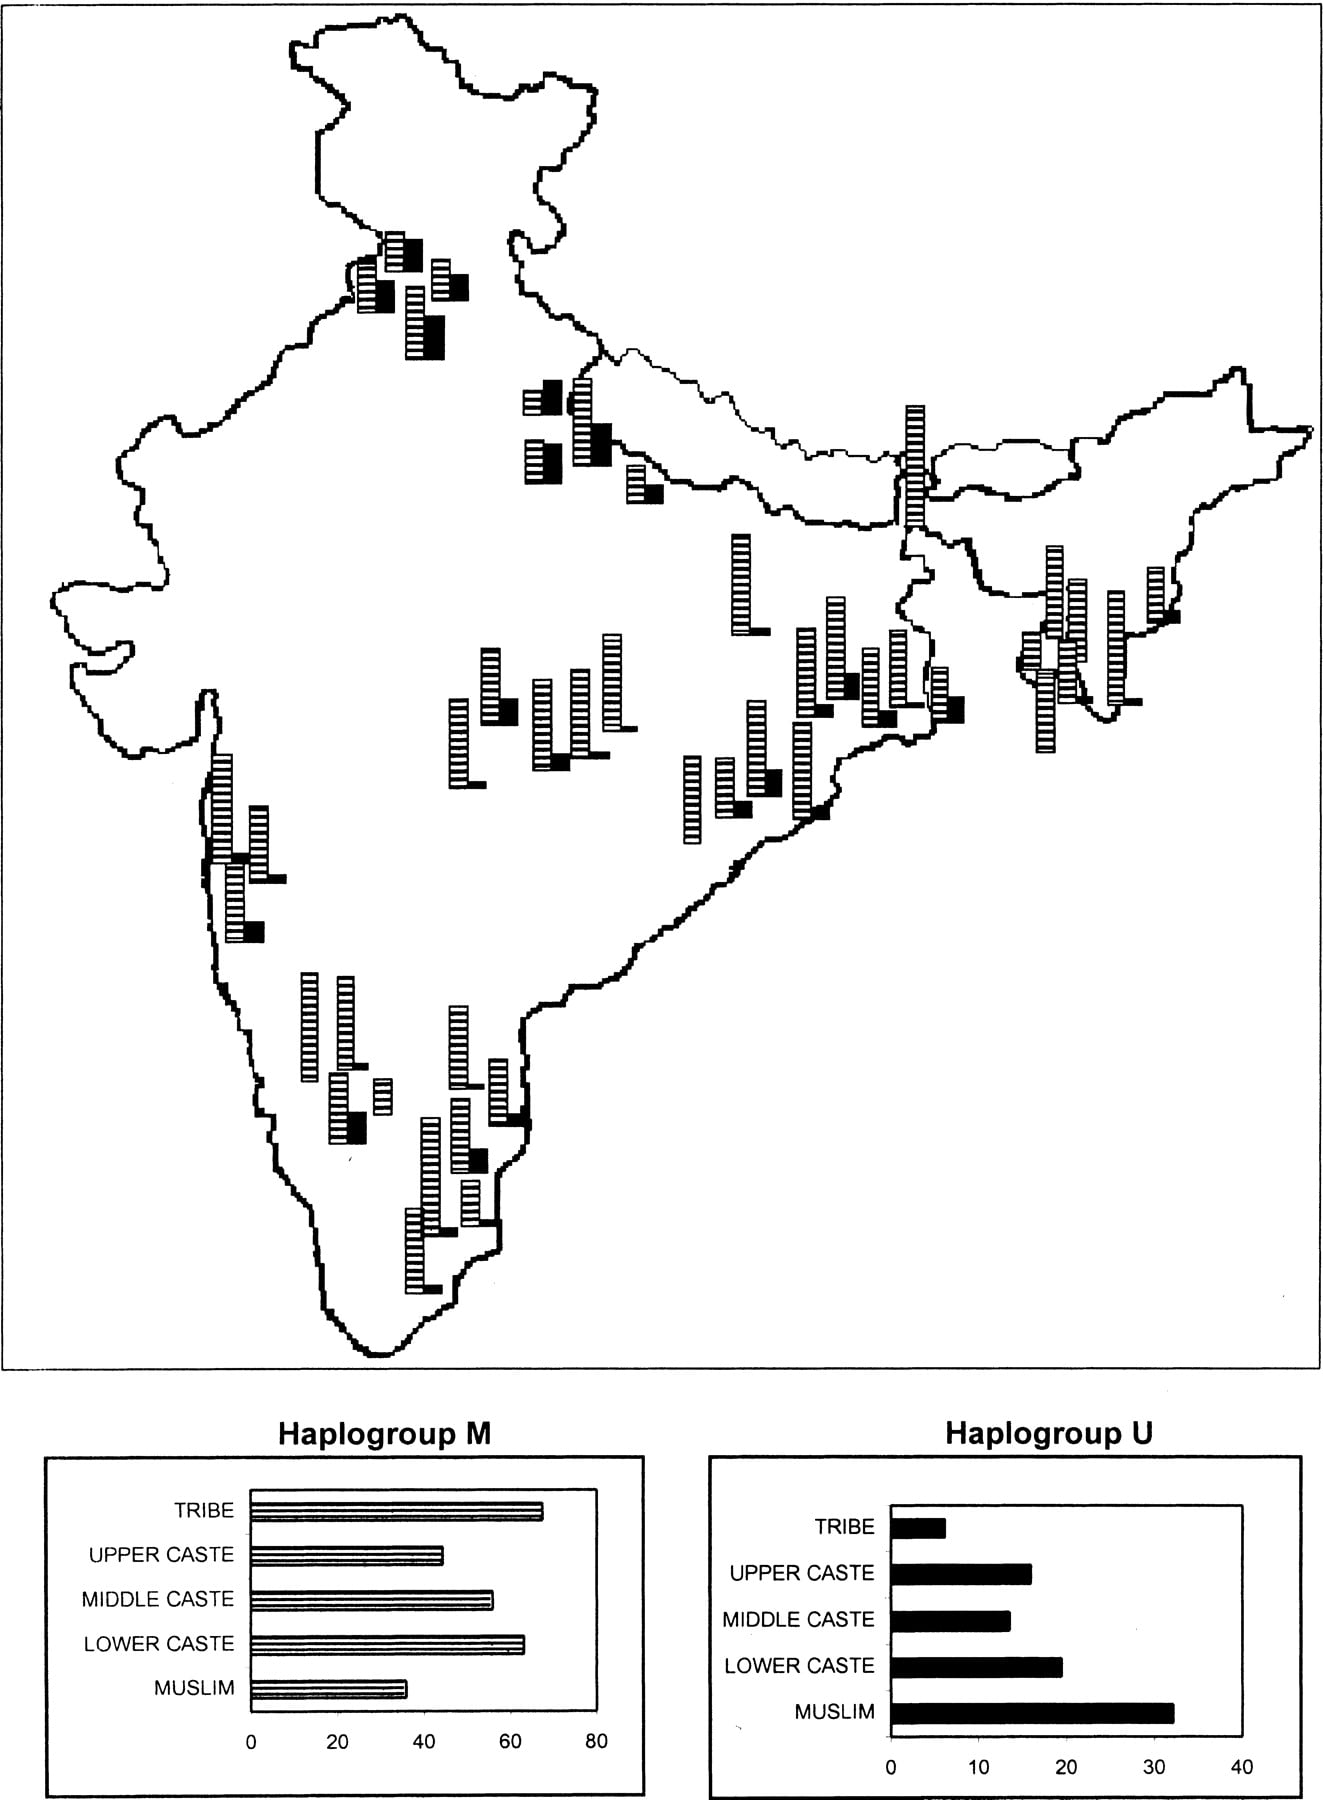
Frequencies (%) of mitochondrial haplogroups M (hatched) and U (solid black) in 44 ethnic populations, and among sociocultural groups of populations (insets).
Frequencies (%) of mitochondrial haplogroups M (hatched) and U (solid black) in 44 ethnic populations, and among sociocultural groups of populations (insets).