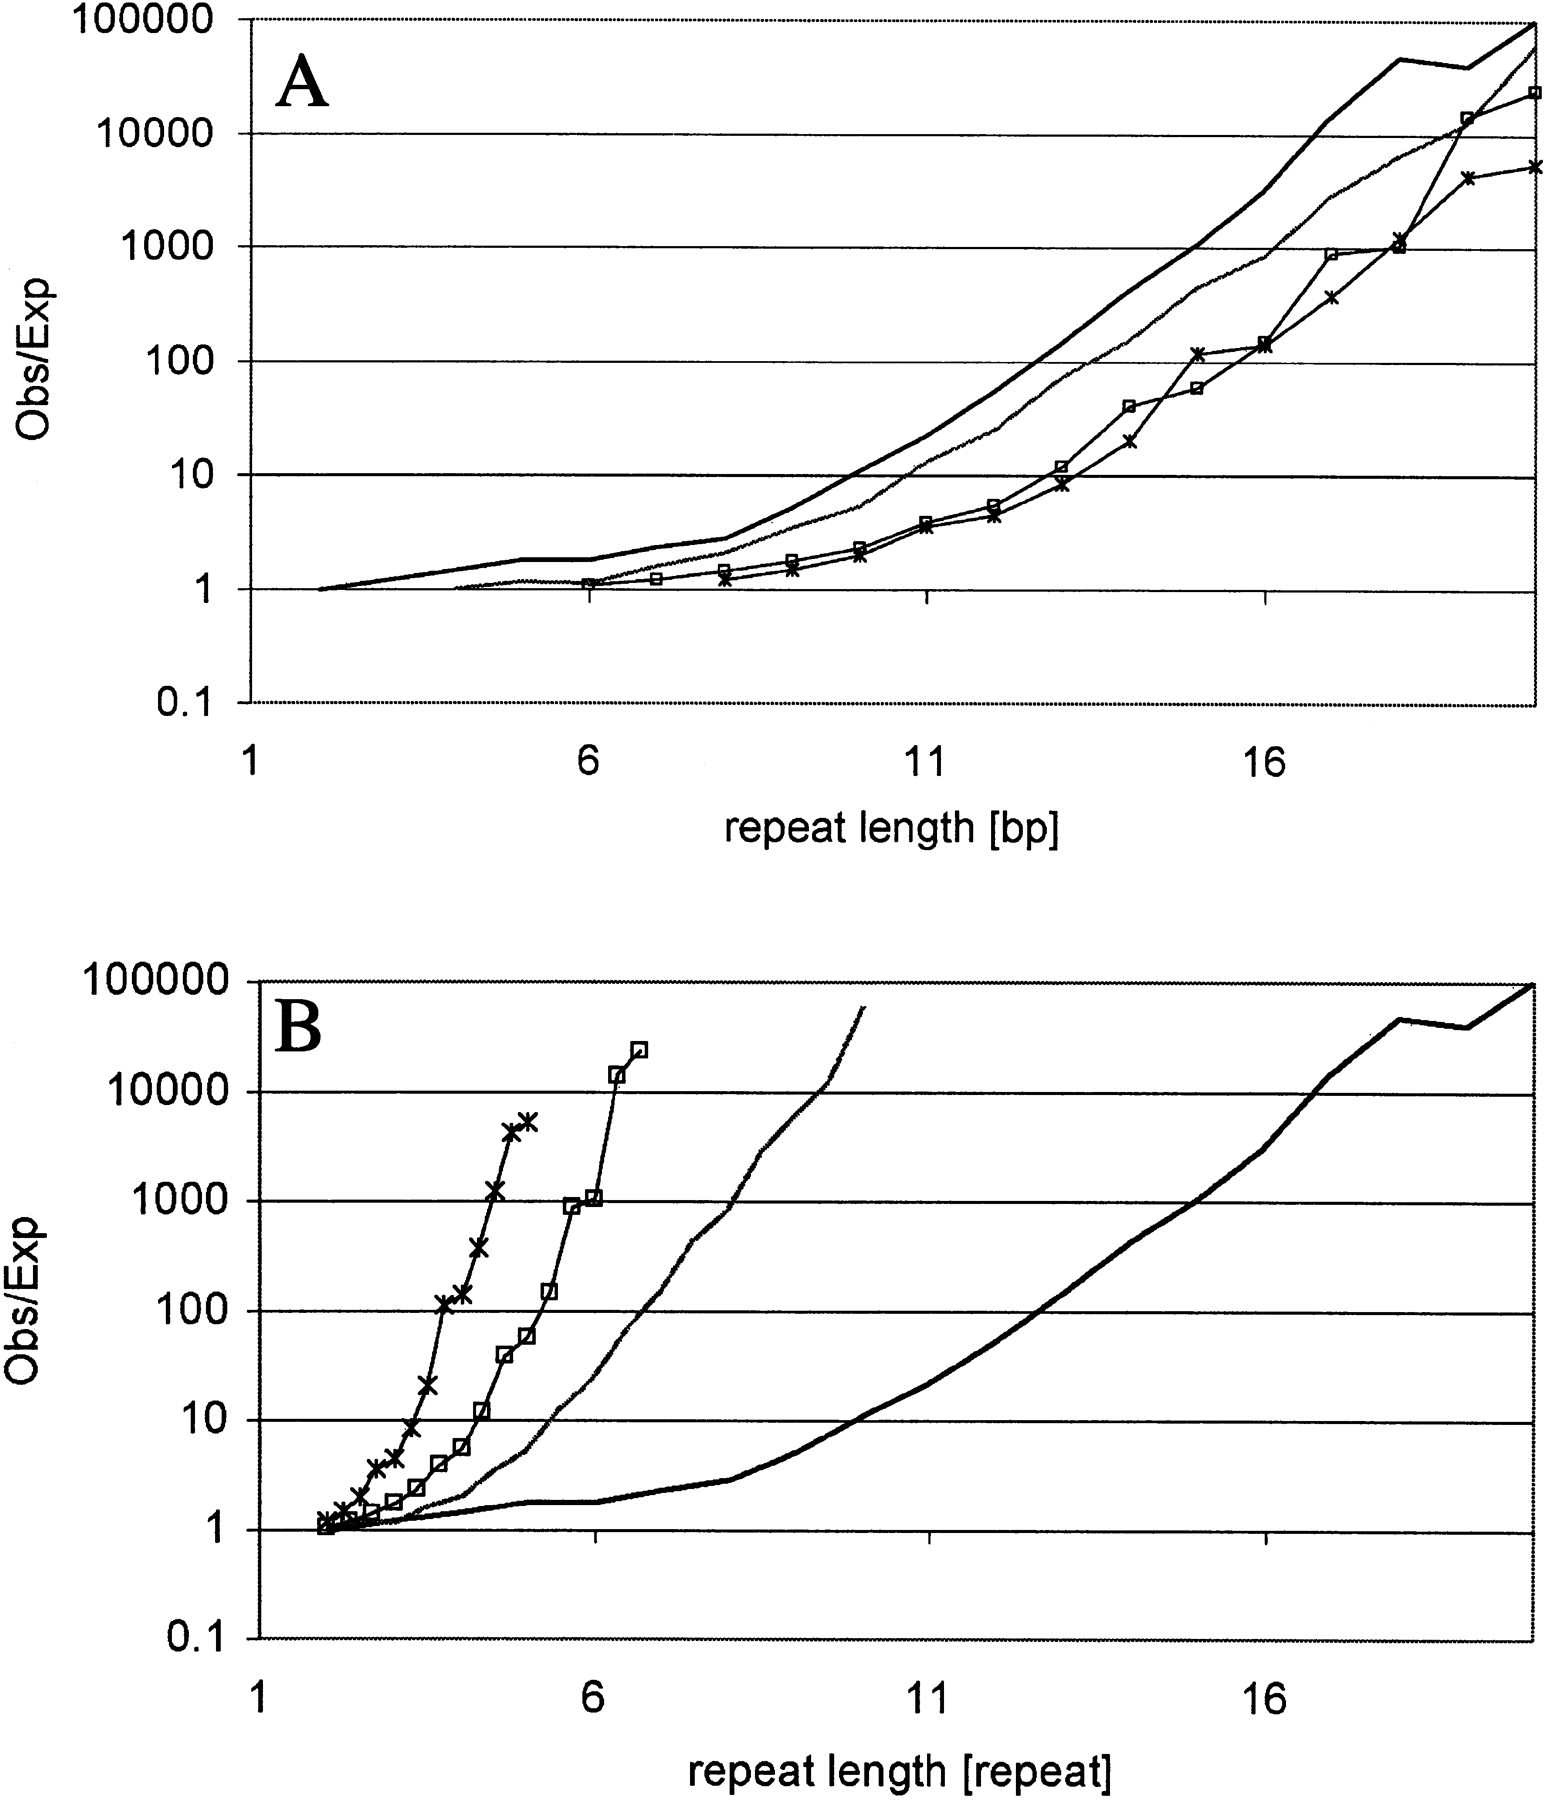
Figure 2
Ratio of the observed density and expected microsatellite density for H. sapiens. (A) Length scaled by absolute length (bp). (B) Length scaled by repeat number. Black lines, mononucleotide microsatellites; gray lines, dinucleotide microsatellites; (□) trinucleotide microsatellites, and (X) tetranucleotide microsatellites.