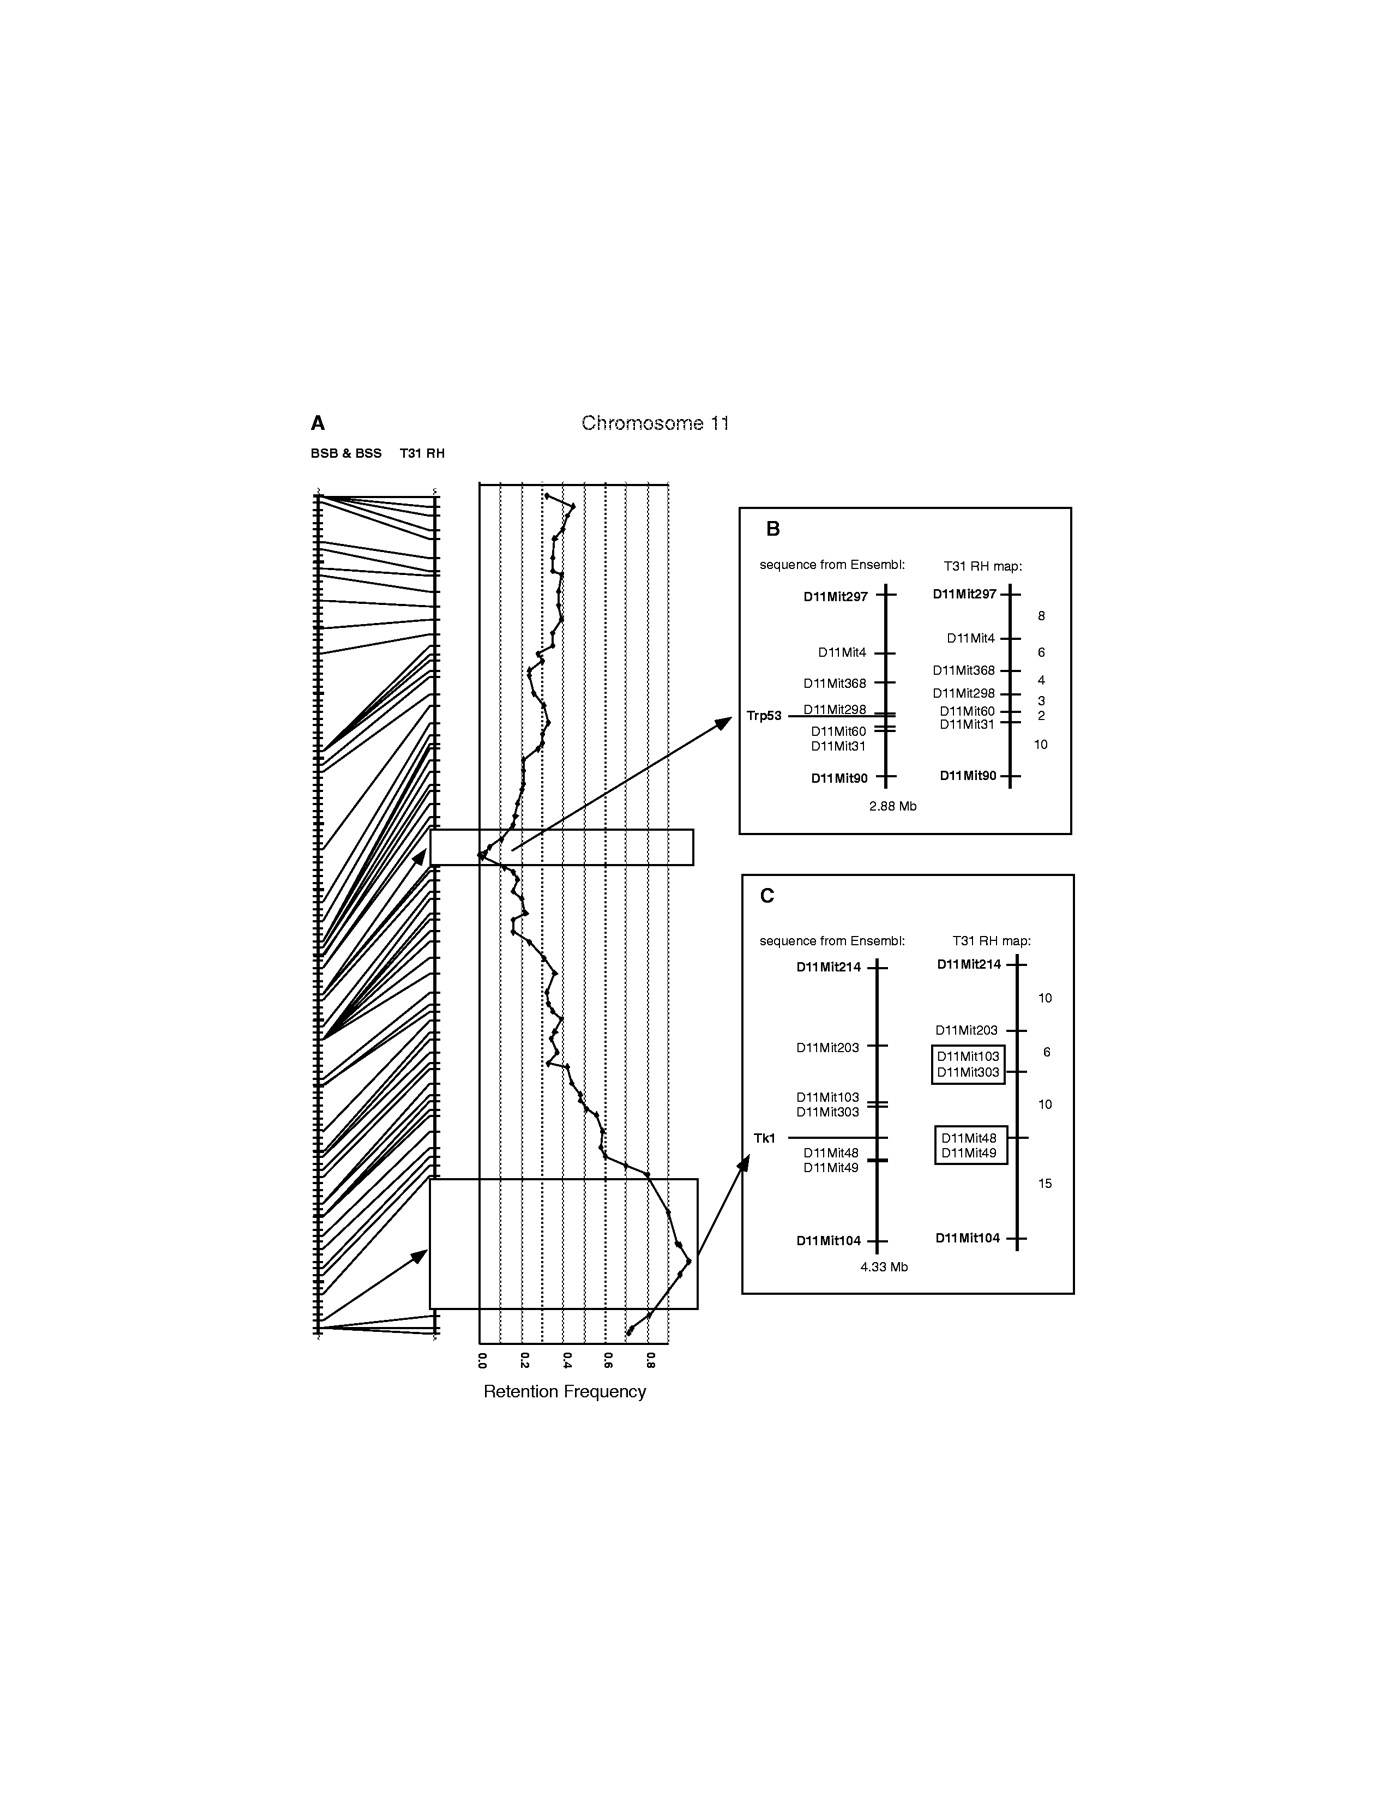
Chromosome 11 framework map (A) showing two gaps in significant linkage due to extreme retention frequencies of markers. TJL BSB/BSS combined backcross map is shown on the left,with crosshatches at each crossover (0.56 cM) and heavier crosshatches every 10 crossovers. Lines join this map to the framework map of Chromosome 11 in the T31 RH data. RH markers are placed at their cR positions. Where the LOD of linkage drops below 6 (minimum significant LOD), an open rectangle is drawn across the RH chromosome line, with the flanking markers at their calculated cR distance apart. Within these low LOD intervals the marker spacing is drawn proportional to the minimum number of obligate segment breaks in each interval. Graphed on the right of (A) is the retention frequency for each framework marker, with x-axis intervals of 10%. The lowest retention frequency is zero and the highest is 100%. The presumed selected markers are assigned a retention rate ofTrp53 = 0% and Tk1 = 100%. (B,C) The low-LOD intervals compared to sequence from Ensembl v3. Sequence maps are drawn to Mb scale. RH maps are set at the same length as the sequence map and RH distances are set proportional to the minimum number of obligate segment breaks in each interval. Numbers to the right of the RH map bars are number of breaks in the interval. Bold locus symbols indicate markers that link with significant LOD to the rest of the chromosome RH data. Plain text locus symbols indicate markers that have interlocus LODs less than 6. Presumed selected marker is shown in bold out to the left of each sequence.