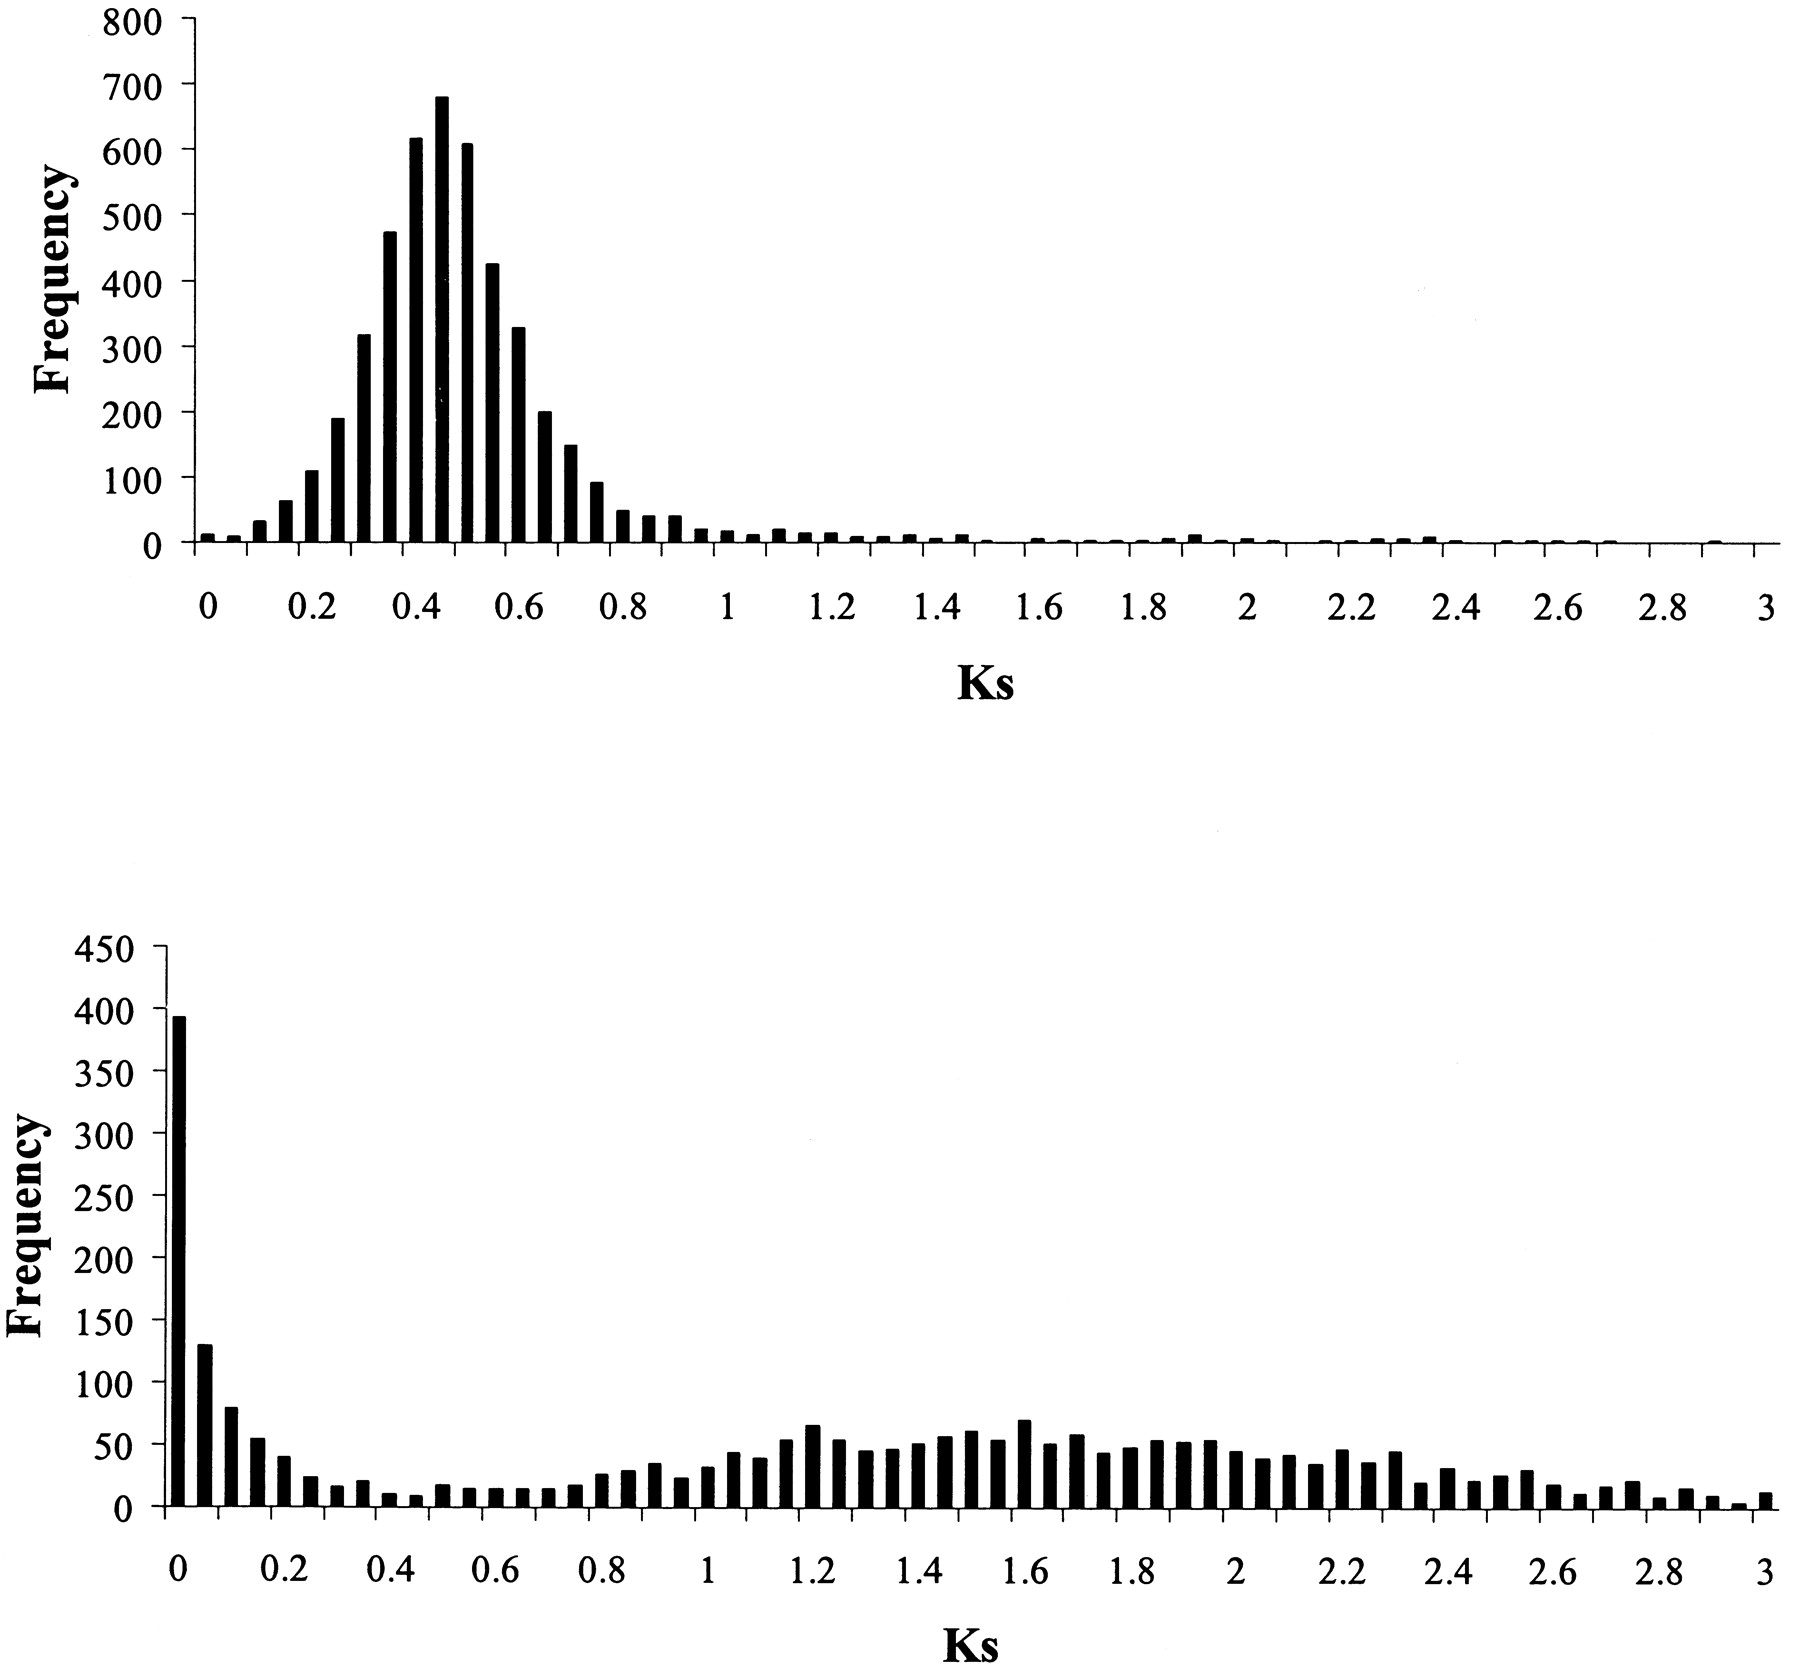
Histogram of KS for human and mouse orthologous gene pairs (A) and for human closest paralog pairs (B).