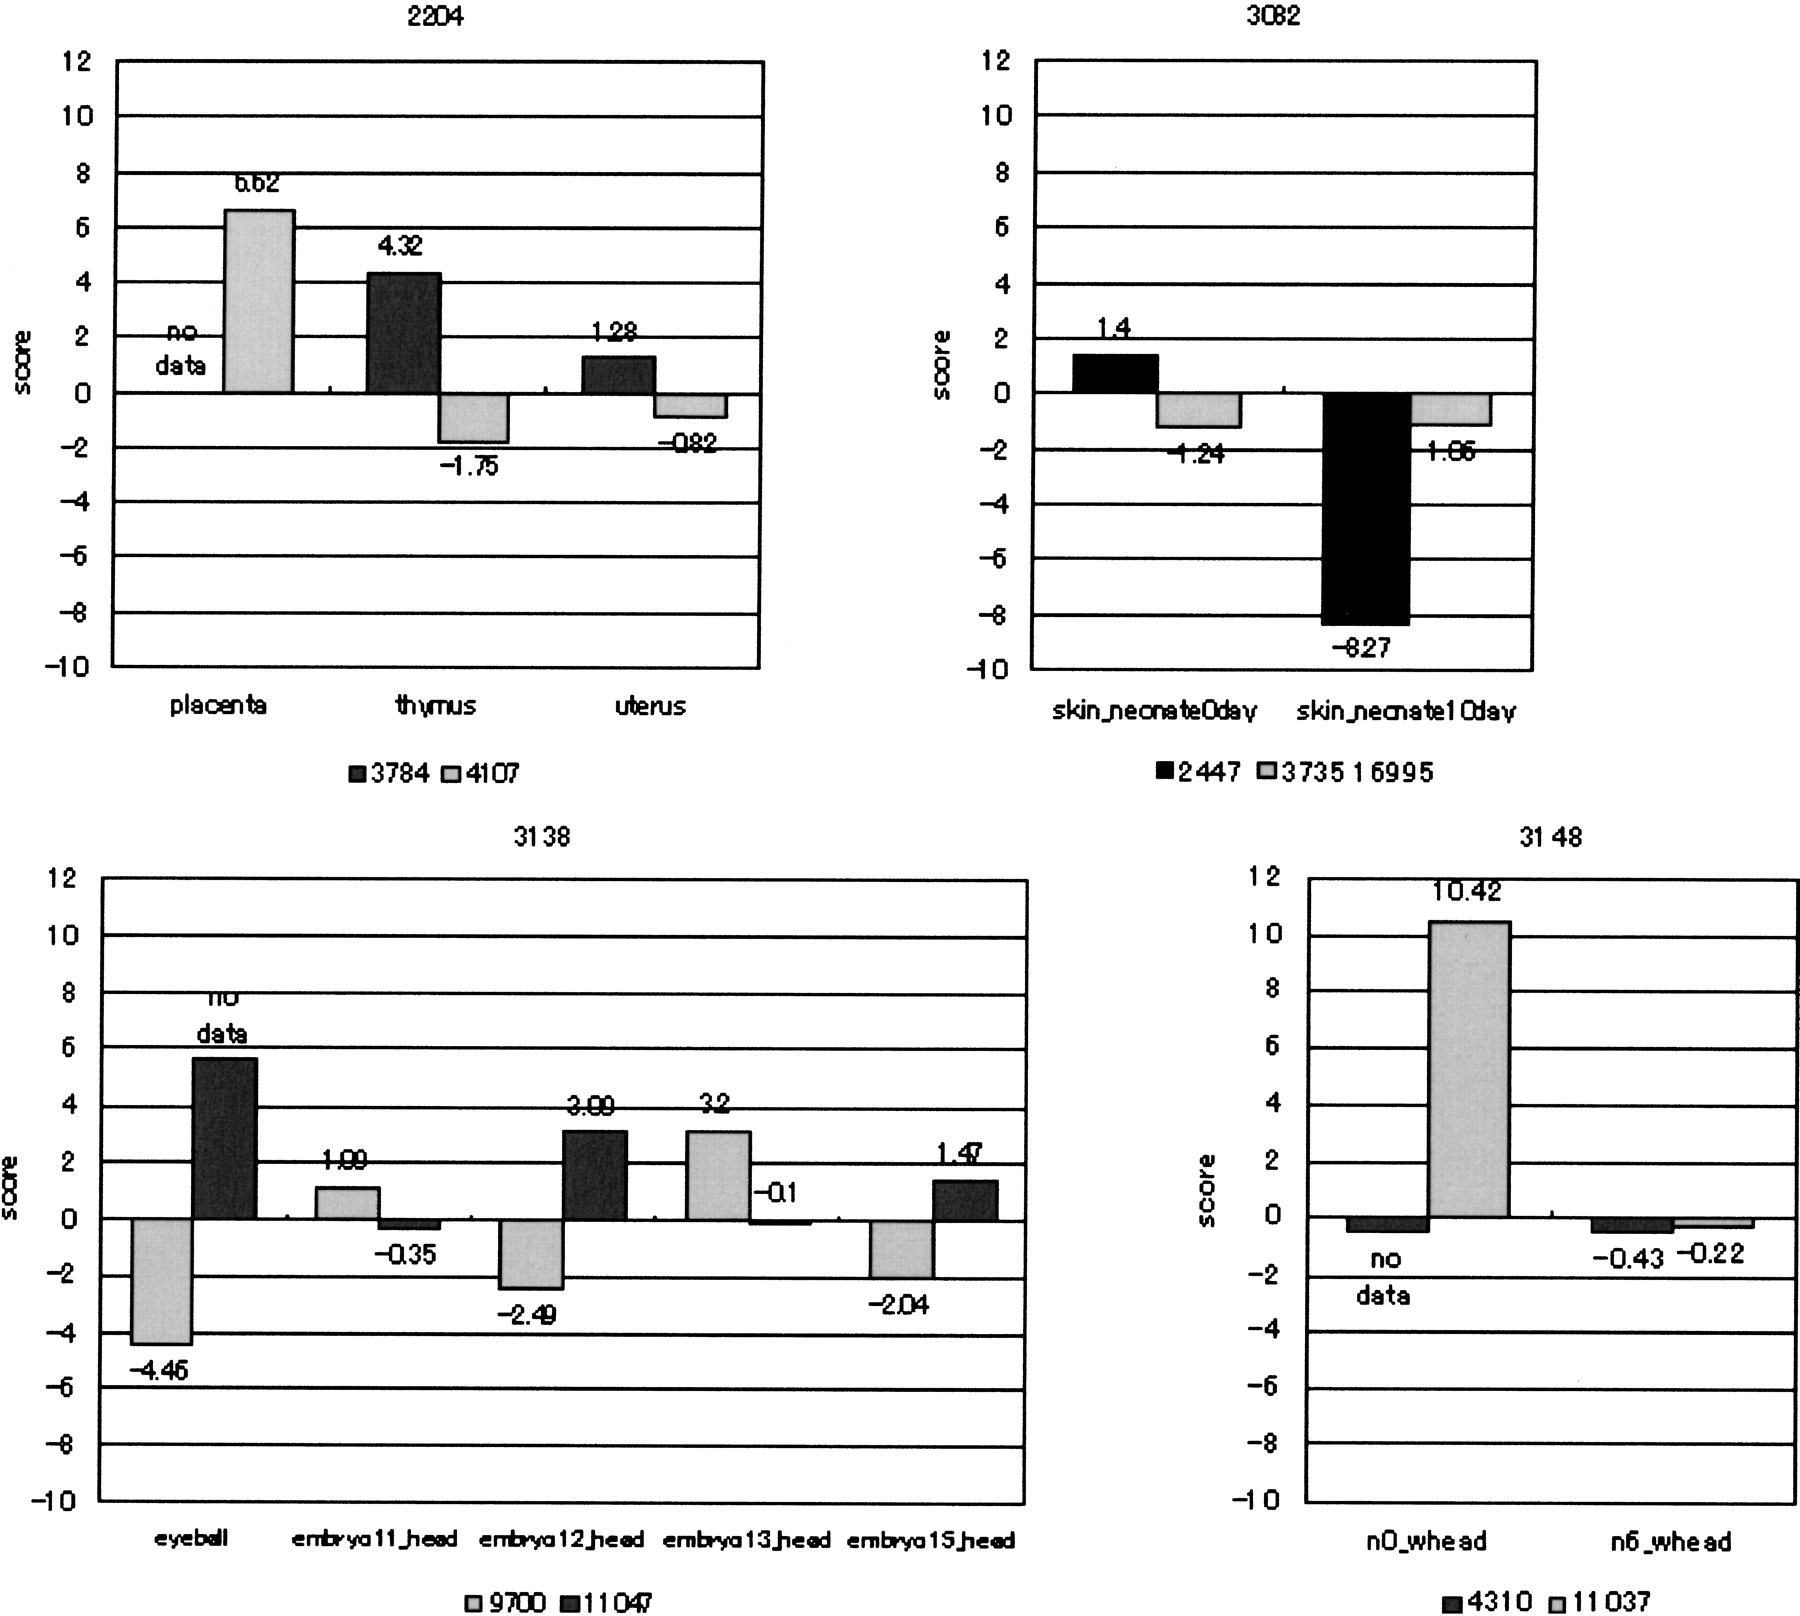
Figure 6.
The horizontal axis is the tissue in which the gene expression was observed. The vertical axis is the level of gene expression as a score of signal intensity between cDNAs (log).
The horizontal axis is the tissue in which the gene expression was observed. The vertical axis is the level of gene expression as a score of signal intensity between cDNAs (log).