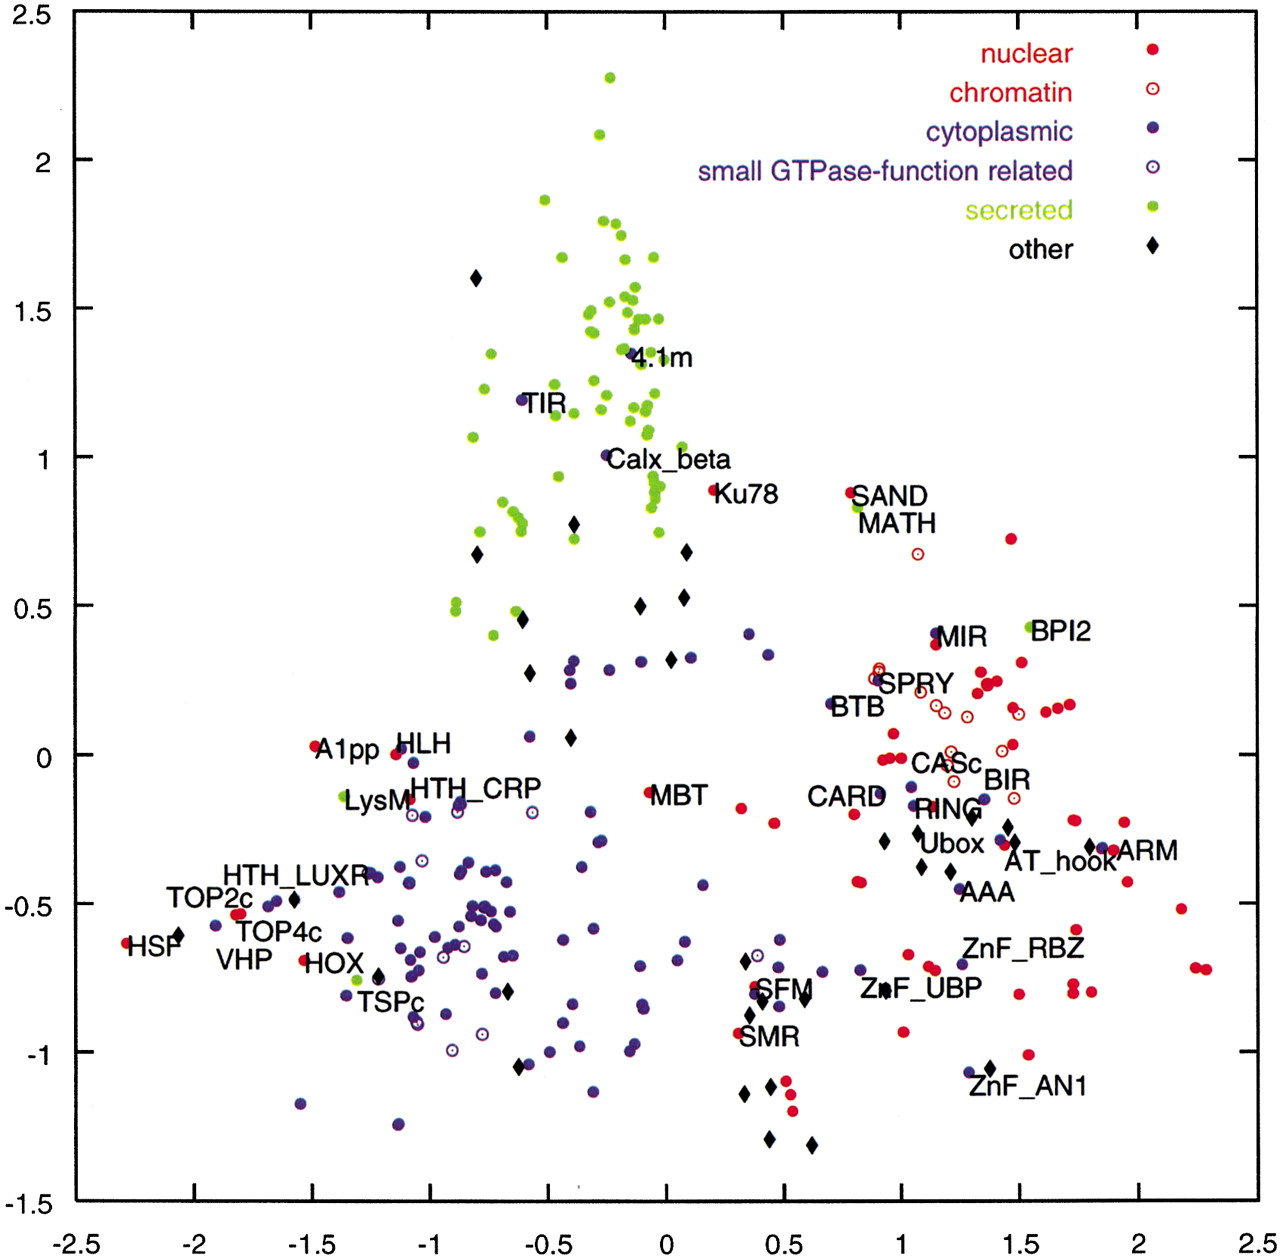
Figure 1.
Domain projection of 300 SMART domains, colored according to their SMART subcellular locales. The axes are the first two principal coordinates in the metric scaling projection. Open circles identify chromatin-related nuclear domains and domains that regulate Ras-like small GTPase functions. The “others” are domains classified in SMART as indiscriminate or multilocale. The labels refer to the misclassified domains in Table 2.