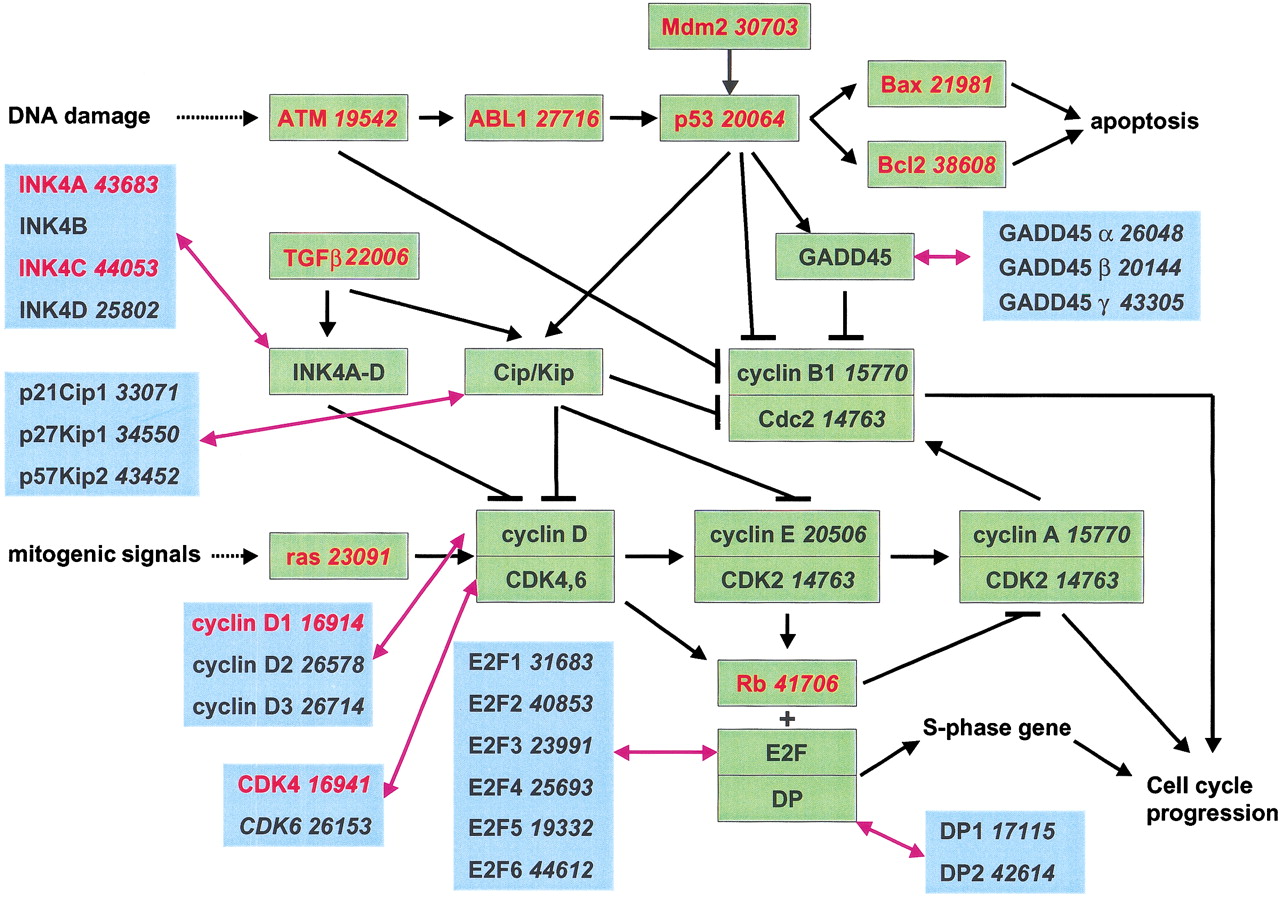
Figure 4.
Representation of the cell cycle control pathway within TIGR Orthologous Gene Alignment (TOGA). The regulatory molecules in the cell cycle are shown in green boxes together with the associated TOGA accession numbers (in italics). When there are multiple proteins for a single element of the pathway, the corresponding TOGA accessions are listed in the adjacent blue boxes (linked by pink bidirectional arrows). Genes associated with human diseases are shown in red.