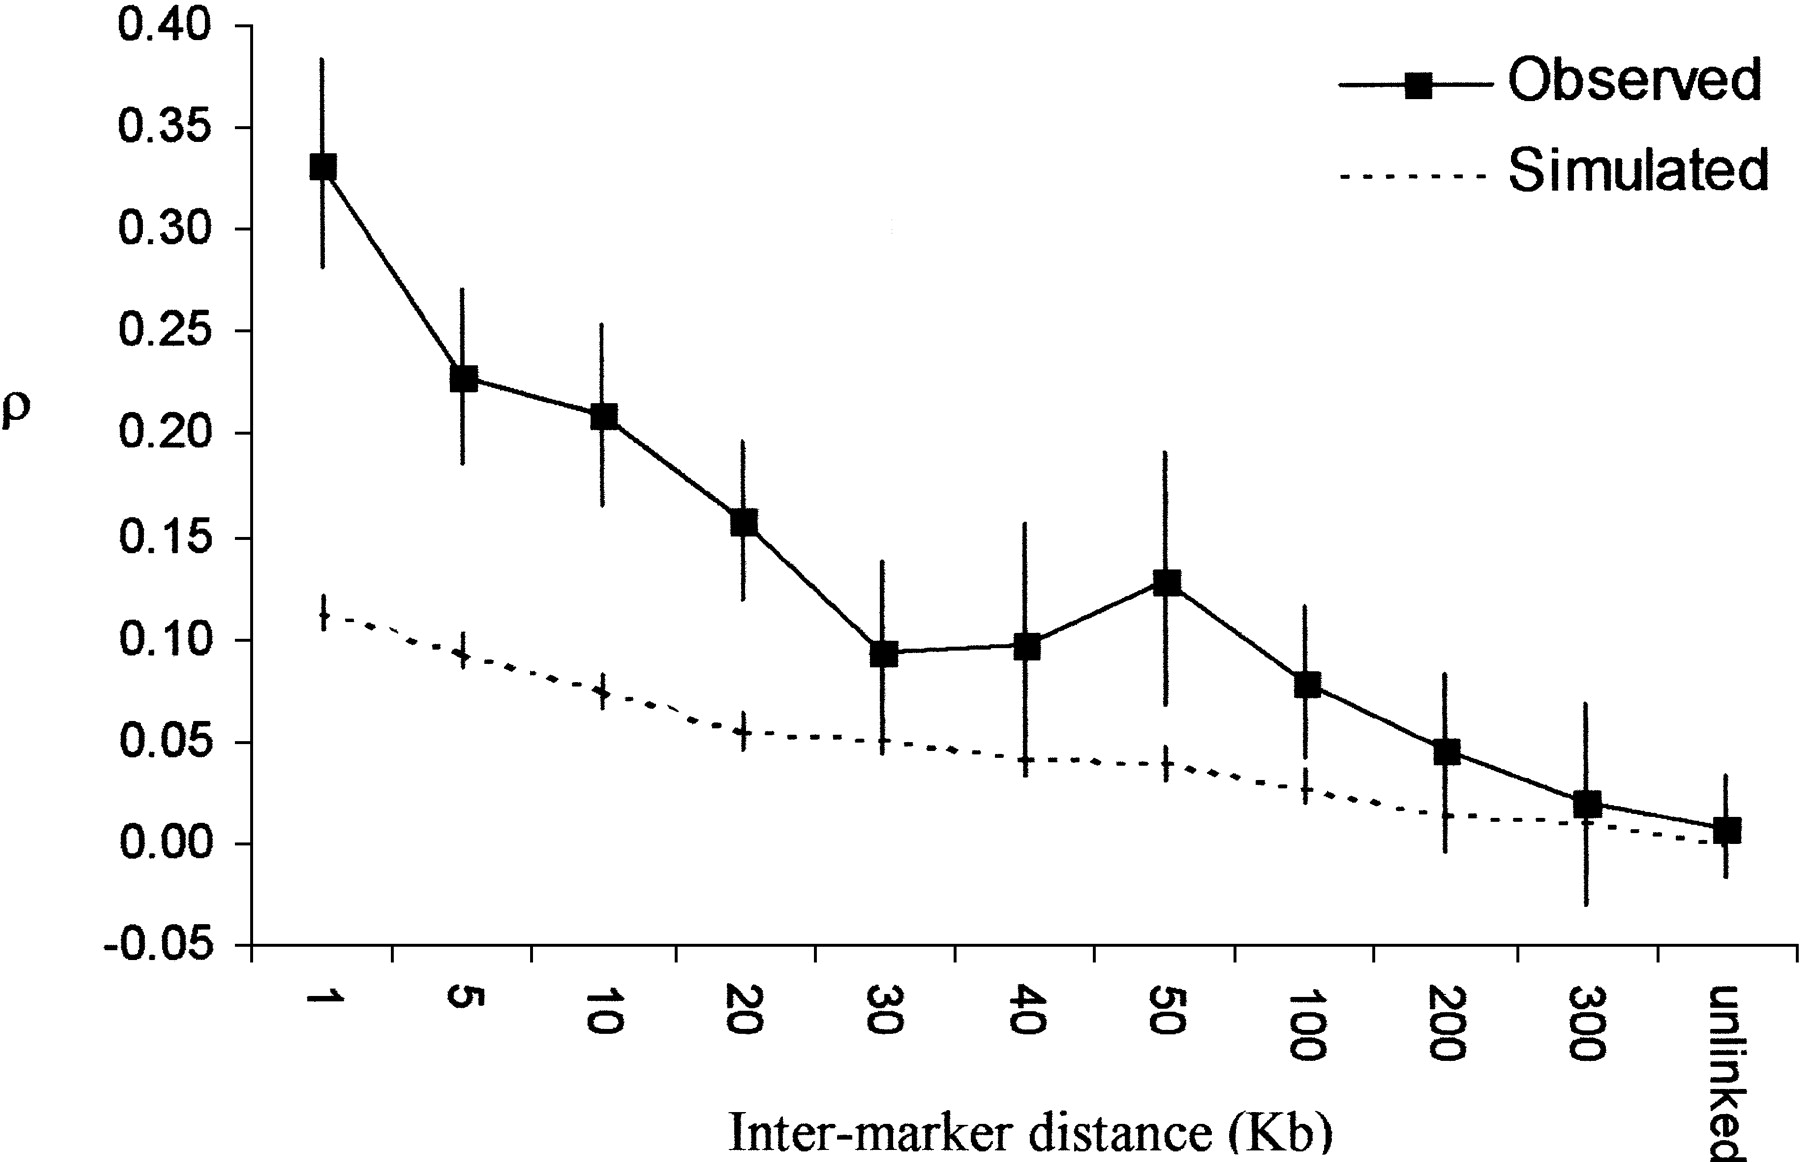
Figure 4.
Correlation between FST values as a function of physical distance. Intermarker distance was calculated between adjacent SNPs across the genome. Marker pairs were then separated into various bins (shown on the X-axis) according to their intermarker distance, and ρ was calculated for each bin. In the observed data, ρ was calculated for unlinked markers by comparing FST values on different chromosomes. Vertical bars represent 95% confidence intervals.