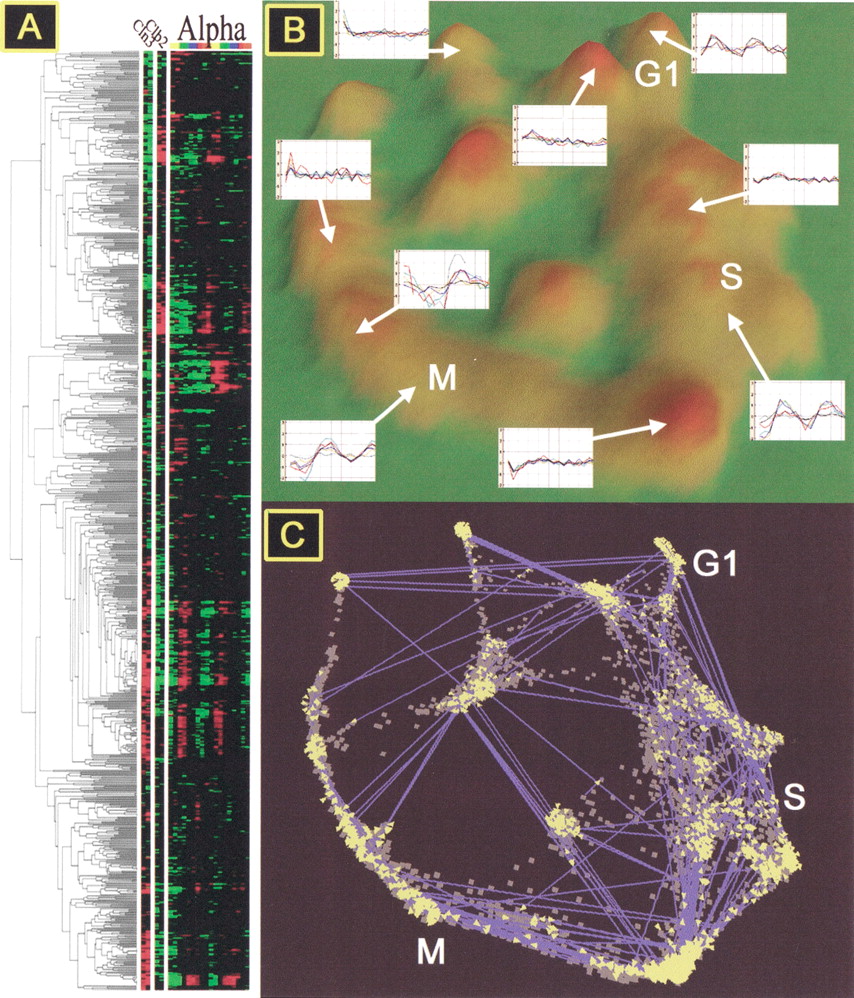
α-Factor–arrest data set (18 time points) ordinated and visualized in VxInsight. (A) Cell-cycle gene expression after α-factor arrest and the dendogram indicating similarities of gene expression as presented by Spellman et al. (Reprinted, with permission, from Spellman et al. 1998.) (B) Three-dimensional topography in which mountains are formed over clusters of genes. The height of the mountain corresponds to the number of genes beneath it. Typical expression profiles for genes in each mountain are provided. G1, S, and M: Genes in these clusters are induced during the G1, S, or M phase of the cell cycle, respectively. (C) Ordination of genes (dots) that underlie the topography with links (blue lines with yellow arrows at each end) showing strong similarities (Pearson's R > 0.887) that exist between genes in different clusters.