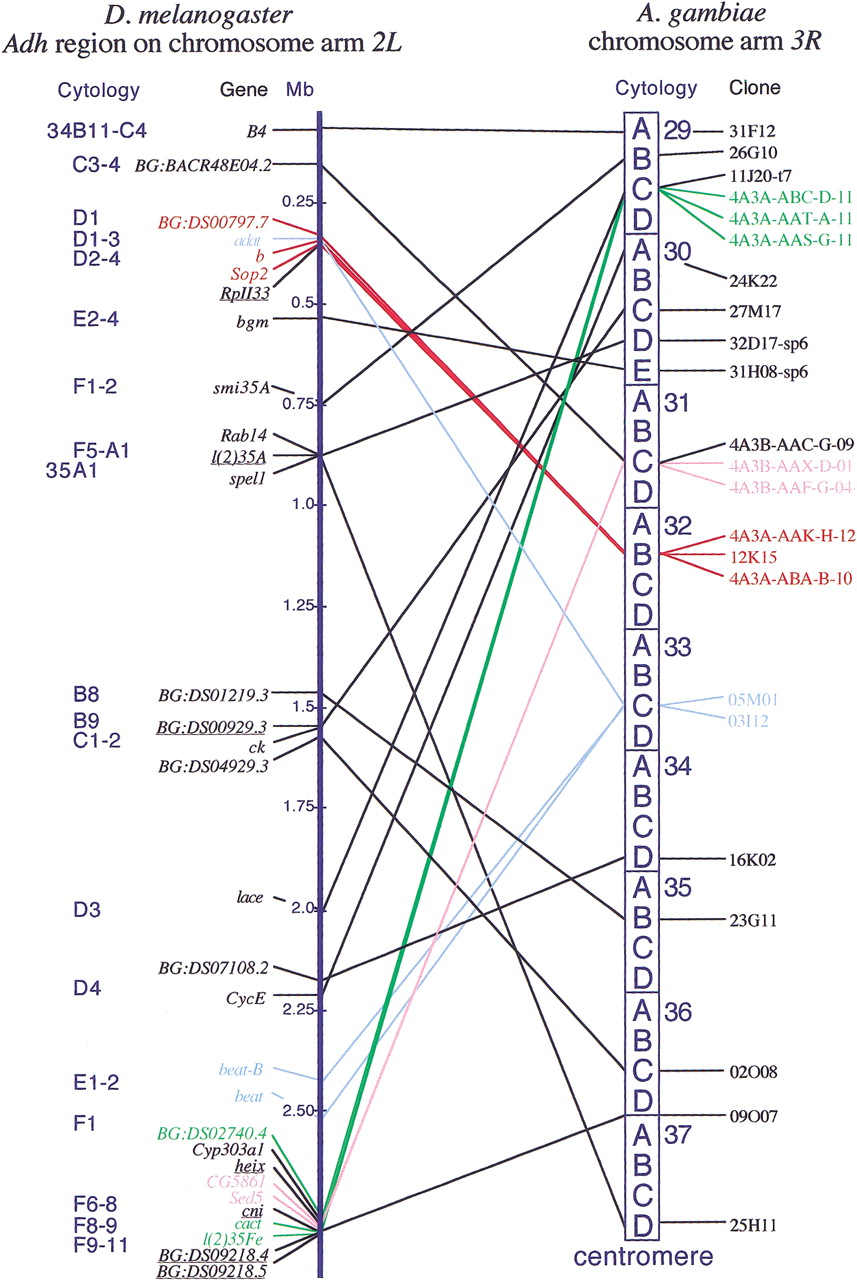
Distribution of Drosophila melanogaster genes of theAdh region and their A. gambiae orthologs on chromosome 3R. The left vertical dark blue bar represents theDrosophila Adh region, listing the names of the genes, their cytological location, and their positions on the molecular map (in megabases) according to Ashburner et al. (1999). Underlined are the genes for which corresponding Anopheles orthologs are not localized on chromosome 3R (see Table 2). The dark blue vertical boxes on the right represent the chromosome arm 3R ofAnopheles gambiae, with numbered divisions and lettered subdivisions. Clones that start with 4A3A or 4A3B are cDNAs, and the rest are STSs from chromosomal BACs. The solid lines point to the cytogenetic locations of these clones. The positions of orthologs are indicated by connecting lines between the Drosophila Adh region and Anopheles chromosome 3R. Colored lines connect A. gambiae cytogenetic gene clusters (green, 29C; pink, 31C; red, 32B; and light blue, 33C) and their respective fruit fly orthologs, also shown in the same color. The two chromosomes are not drawn to scale.