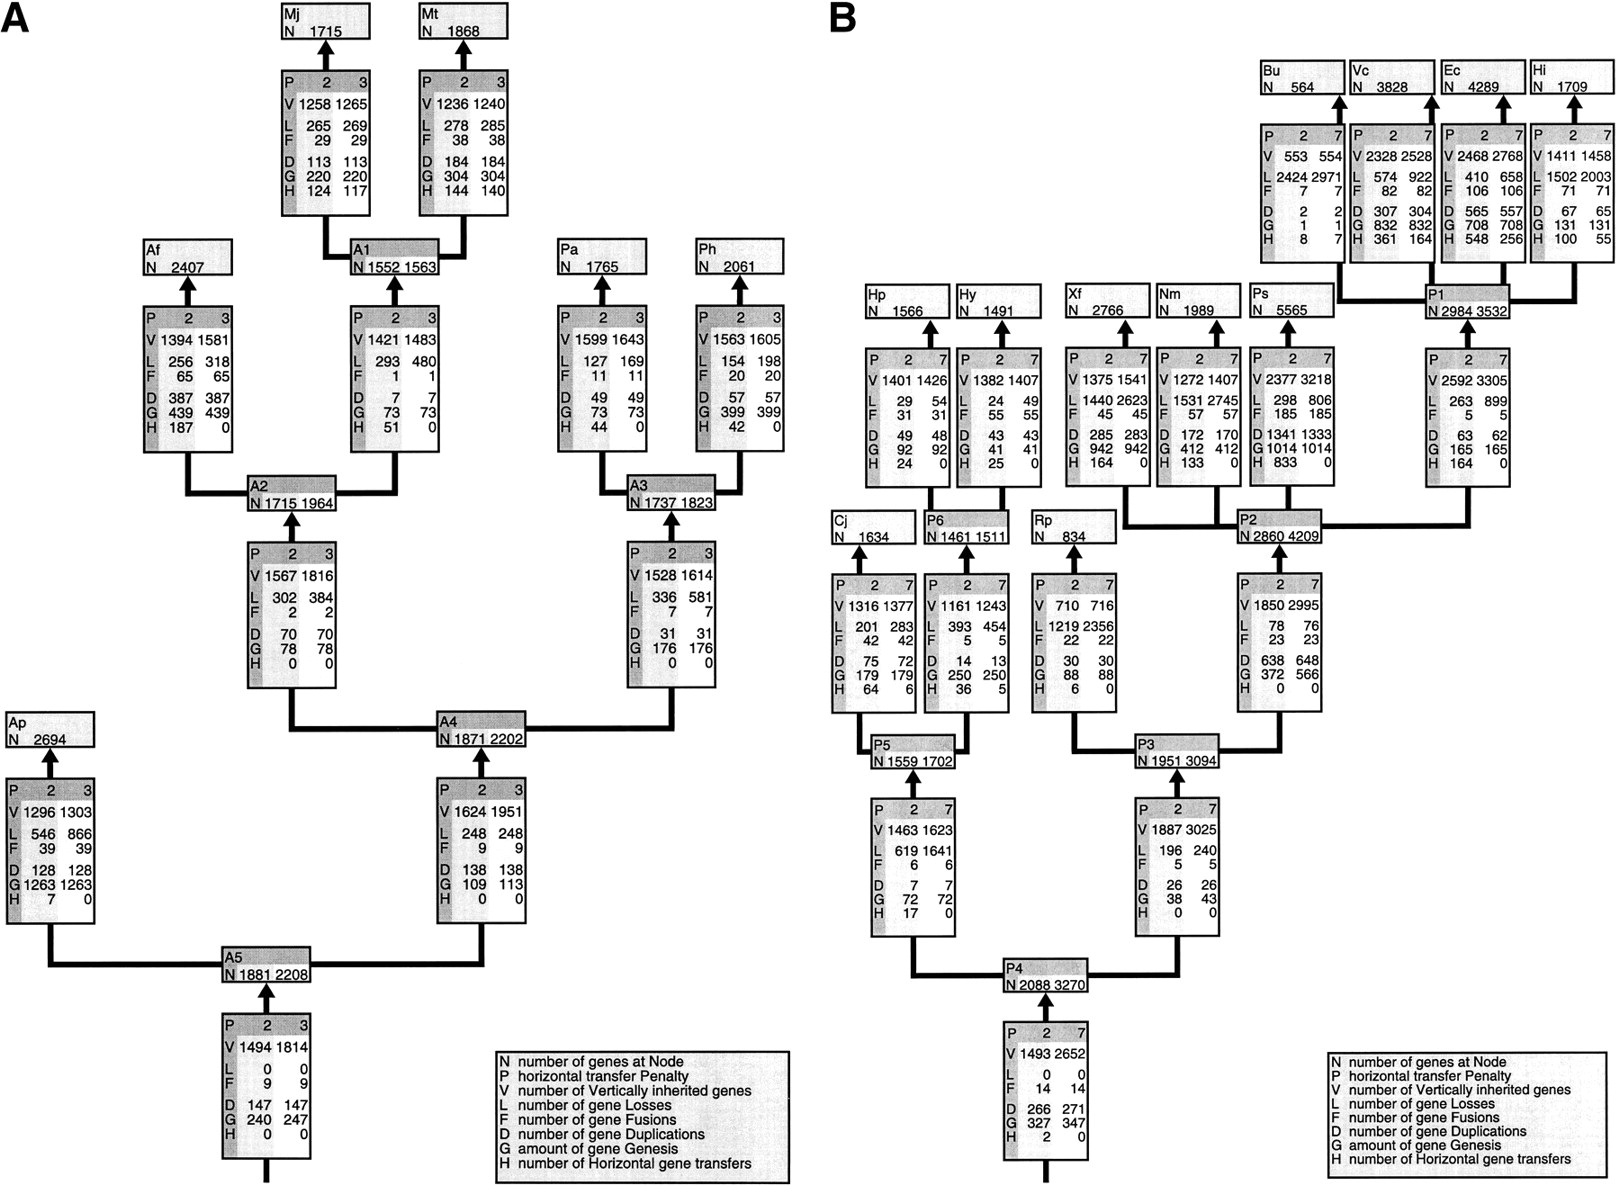
An integral reconstruction of genome evolution. The panels show a tree topology that reflects the assumed phylogeny of the species we analyzed, with our results for the evolution of gene content mapped onto them. We give the results for the reconstruction under two different transfer regimes. The branch lengths do not reflect evolutionary time. Two-letter abbreviations denote the species initials at the leaves. The ancestral nodes have names that consist of one character to denote their taxon (‘A’ for Archaea and ‘P’ for Proteobacteria) and a number to distinguish them from each other. At each node is indicated how many genes we propose to have been present in that ancestor under two different HGT penalties. On the branches, all the processes are enumerated by their character code followed by how often that event occurred under two different scenarios. The meaning of the character codes is shown in the insets. (A) The results for the Archaea. The two-letter codes for the Archaeal species are as follows: Af, Archaeoglobus fulgidus; Ap, Aeropyrum pernix; Mj, Methanococcus jannaschii; Mt,Methanobacterium thermoautotrophicum; Pa, Pyrococcus abbysii; and Ph Pyrococcus horikoshi. The first number for the processes and the ancestral genome sizes is at an HGT penalty of 2, and the second at an HGT penalty of 3. (B) shows the results for the Proteobacteria. Bu, Buchnera sp. APS; Cj,Campylobacter jejuni NCTC 11168; Ec, Escherichia coli; Hi, Haemophilus influenzae; Hp, Helicobacter pylori 26695; Hy, Helicobacter pylori J99; Nm,Neisseria meningitidis MC58; Ps, Pseudomonas aeruginosa PA01; Rp, Rickettsia prowazekii; Vc,Vibrio cholerae; and Xf, Xylella fastidiosa. The first number for the processes and the ancestral genome sizes is at an HGT penalty of 2, and the second at an HGT penalty of 7.