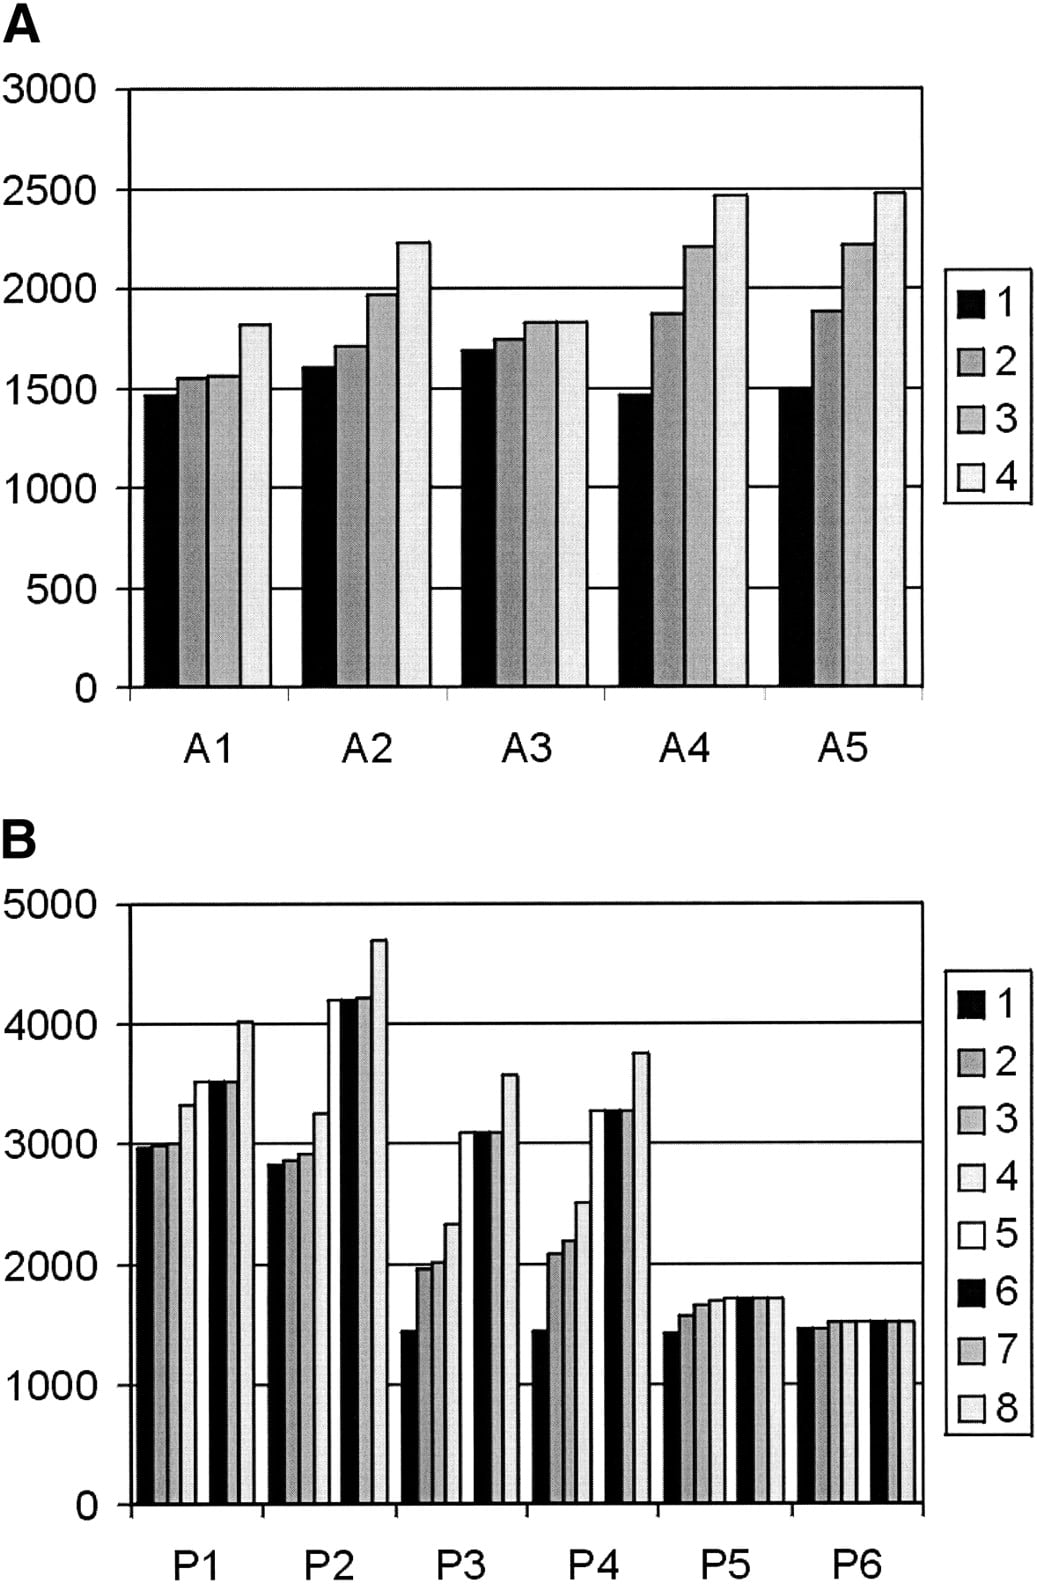
Figure 3.
Histogram of the estimates for ancestral genome sizes for increasing HGT penalties. To see where in the tree the different ancestral nodes are present, see Figure 4. The different HGT penalties are given in the legend. The results for (A) Archaea and (B) Proteobacteria are shown.