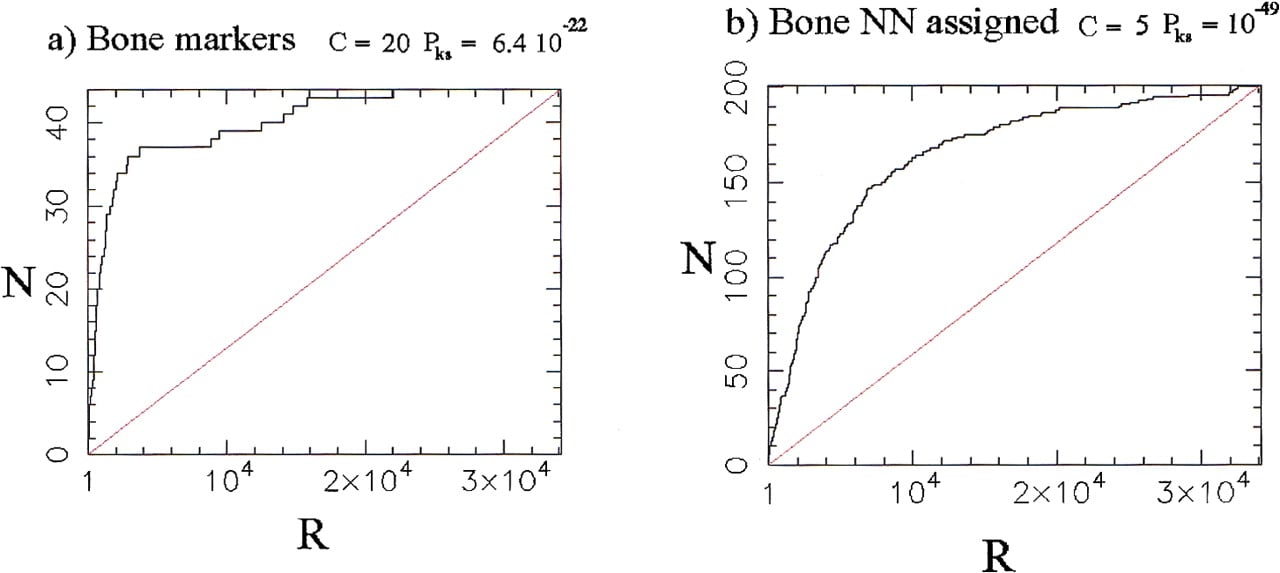
Distribution in the χ2 statistic of the Bone markers and of qualifiers assigned to Bone by GENNC using the C2C12 data set, relative to the expression data from the calvaria primary cell cultures. In each figure, a rank R of 1 denotes the most variable (significant) profile, a rank of 34,130 the least variable (least significant) profile. N indicates the cumulative number of markers found with rank below or equal to the rank R indicated on the abcissa. C denotes the profile concentration of the qualifiers (see text and equation 3 in Methods) and Pks the companionP value. The straight lines indicate the distributions expected if markers are positioned at random in the global population. (a) Distribution of the 44 Bone markers (from the training set); (b) distribution of the 201 qualifiers assigned to Bone by nearest-neighbor classification (N χ2 = 2500, k = 2, andP 0 = 0.01).