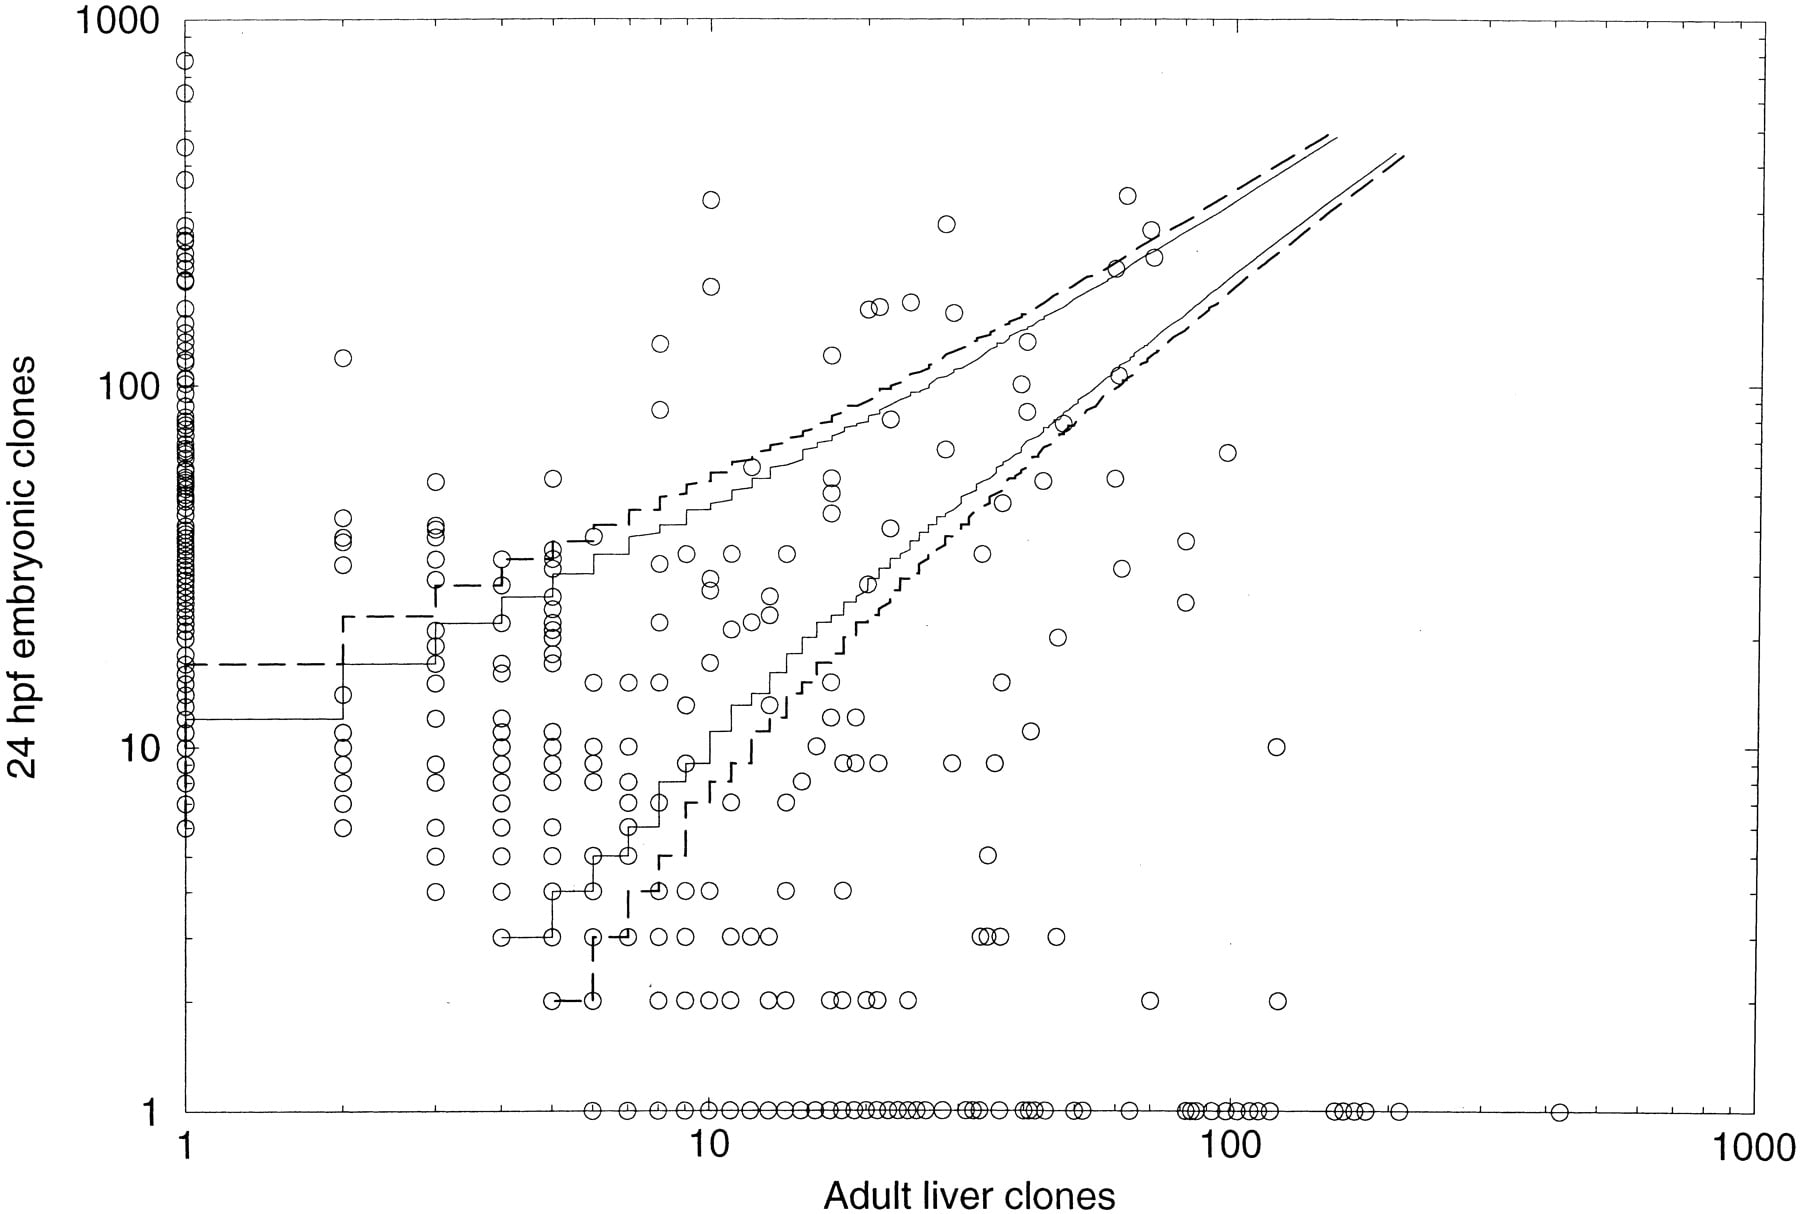
Figure 3.
We used the number of clones in a cluster from each library as a measure of the level of the transcripts in the starting materials and plotted the adult liver and late somitogenesis on the X andY-axis, respectively. Each circle represents an OFP2 clone cluster (transcript). The lines correspond to the bands of the 90% (filled line) and 95% (broken line) confidence intervals of the two-sided binomial test. Clusters outside of these bands are significantly differentially expressed according to the respective significance levels. Many of the clusters are composed solely of embryo or liver clones.