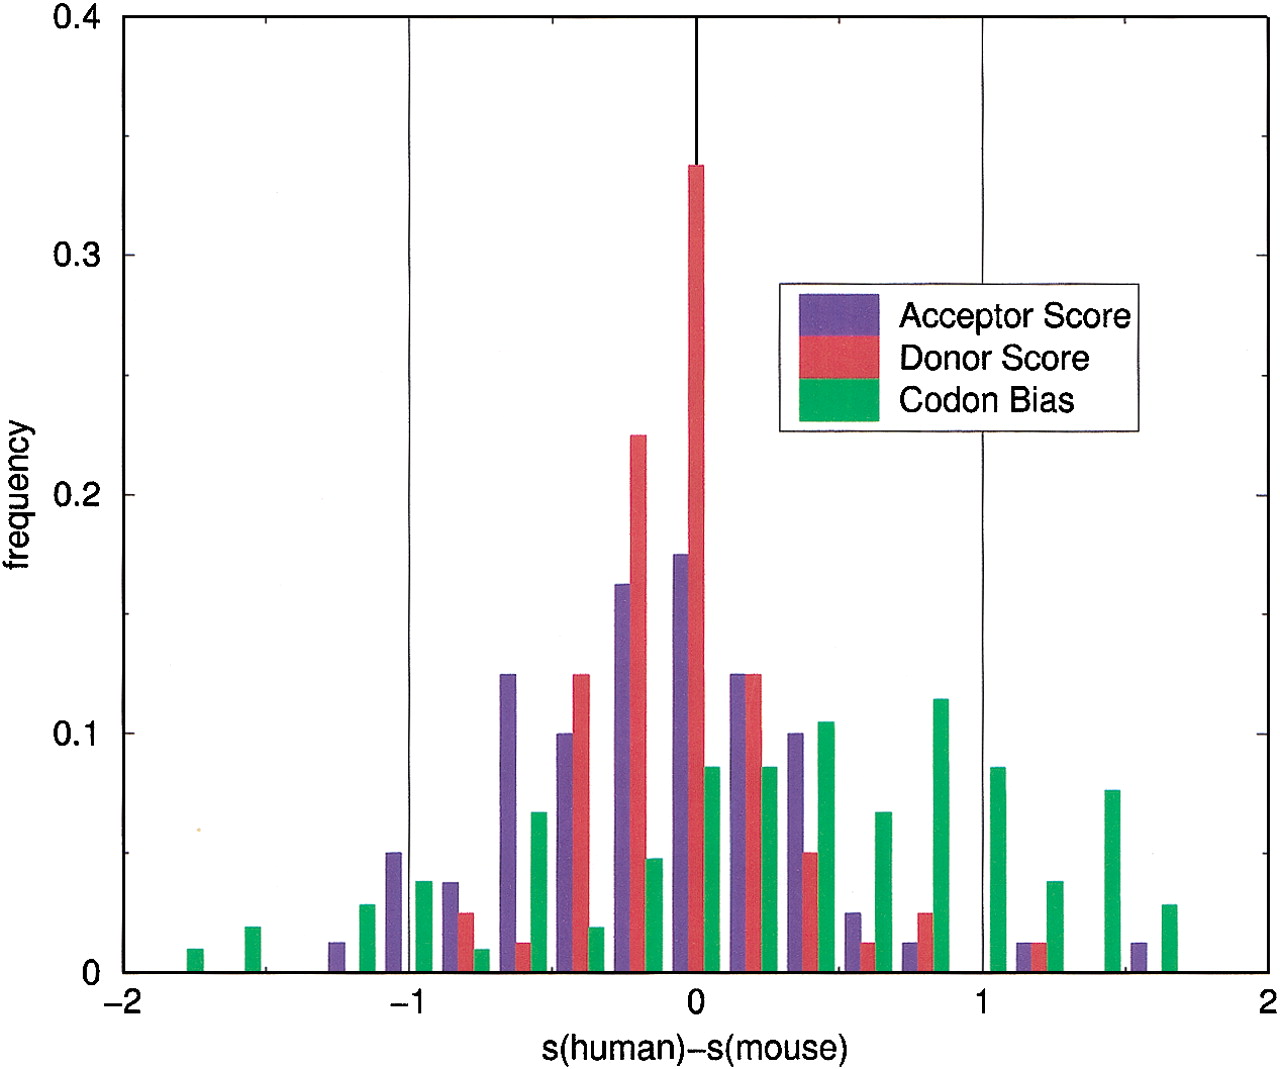
Figure 3.
Distributions of score differences in data set S1. Shown is the distribution for the scores of acceptors (a) and donors (d) and for the codon bias (c). Codon bias was calculated with CodonW(Peden, 1997) separately for each pair of homologous coding sequences in set S1. To bring the numerical values fora,c, and d on the same scale, we divided the numbers obtained by the respective sample standard deviation ςi, i = a,d,c. Based on a two-tailed Student'st-test, the hypothesis that the mean of the distribution is zero is not rejected for acceptors nor for donors. However, it is rejected for codon bias (P = 4.5×10⁻⁶).