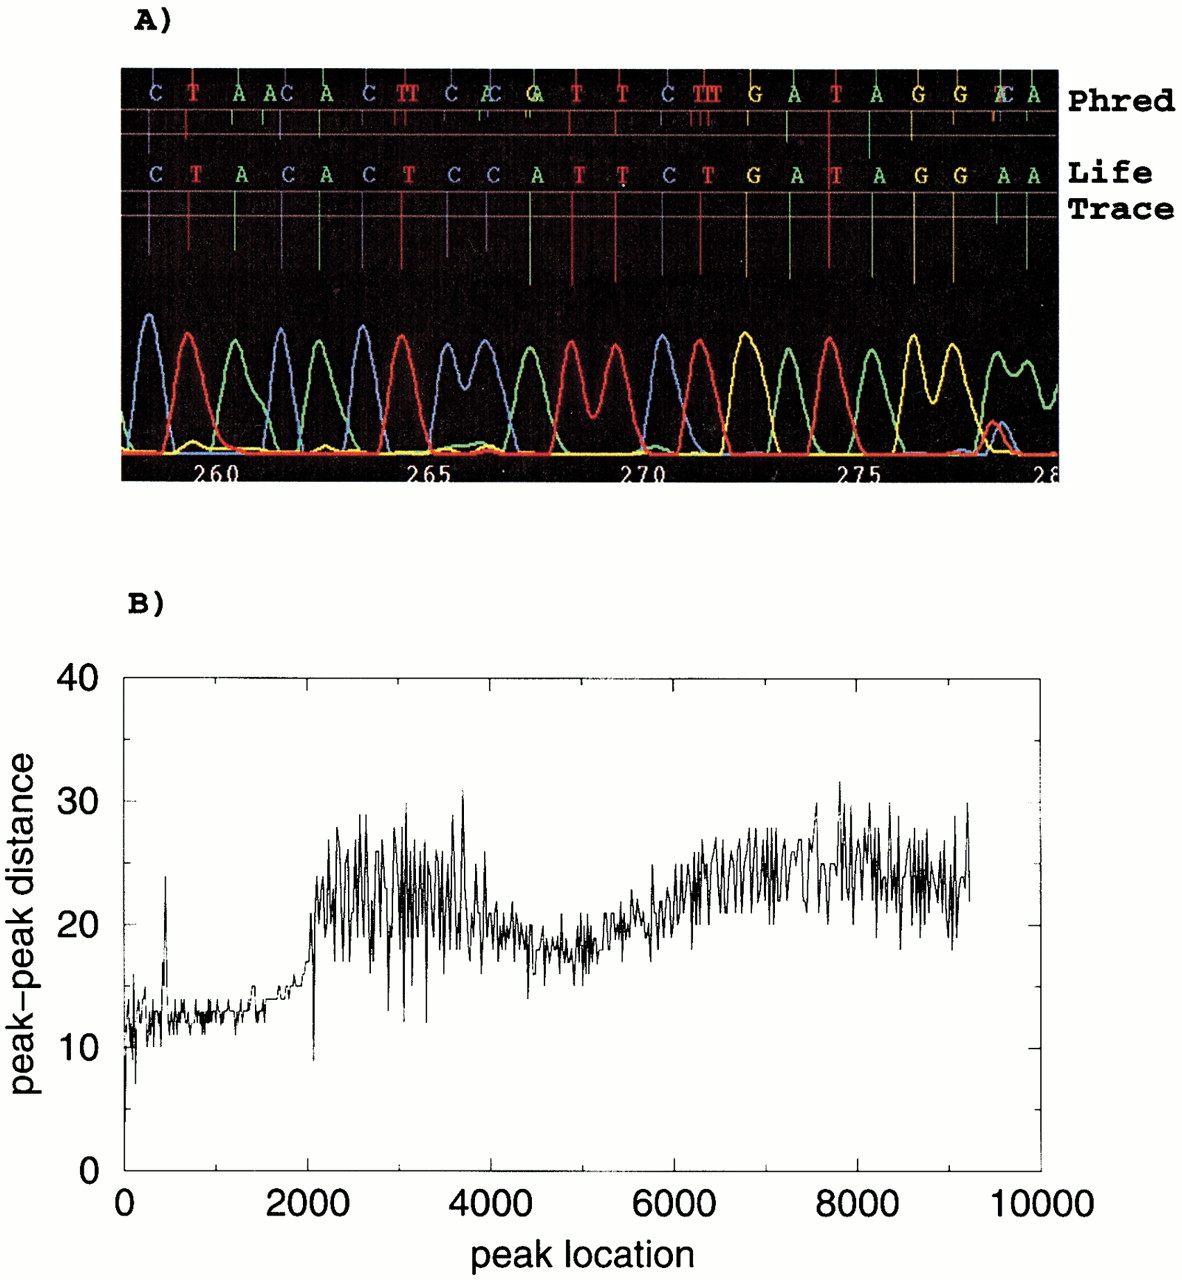
Figure 1.
(A) Sample MegaBACE chromatogram with corresponding basecalls by Phred (top) and LifeTrace(bottom). Length of peak locator tick lines corresponds to associated quality scores, with longer ticks indicating higher quality. Horizontal lines mark quality score levels of 0 and 15, respectively. (B) Peak–peak distance as a function of peak location as determined by LifeTrace. For every peak at a given chromatogram location (x-axis), its associated distance to the next peak is plotted (y-axis). The chromatogram segment shown in A corresponds to chromatogram location between 4000 and 4400.