Figure 4.
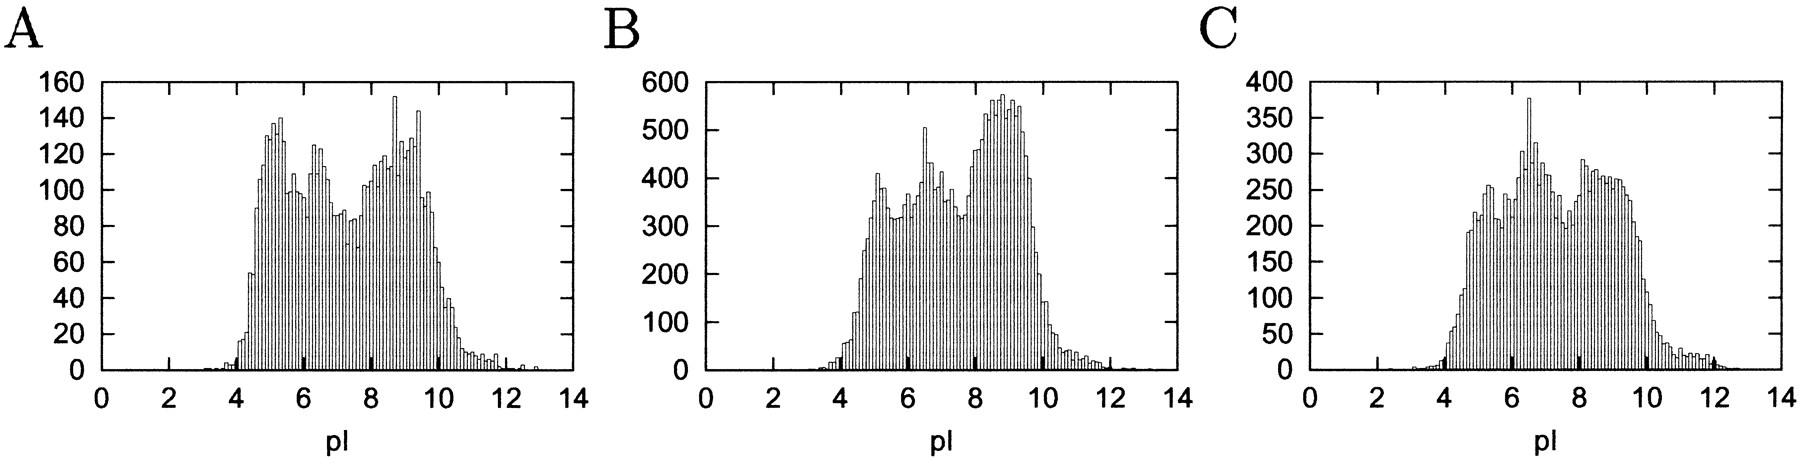
Histograms of pI for predicted ORFs of (A) Saccharomyces cerevisiae, (B) Caenorhabditis elegans, and (C) Drosophila melanogaster.
Histograms of pI for predicted ORFs of (A) Saccharomyces cerevisiae, (B) Caenorhabditis elegans, and (C) Drosophila melanogaster.