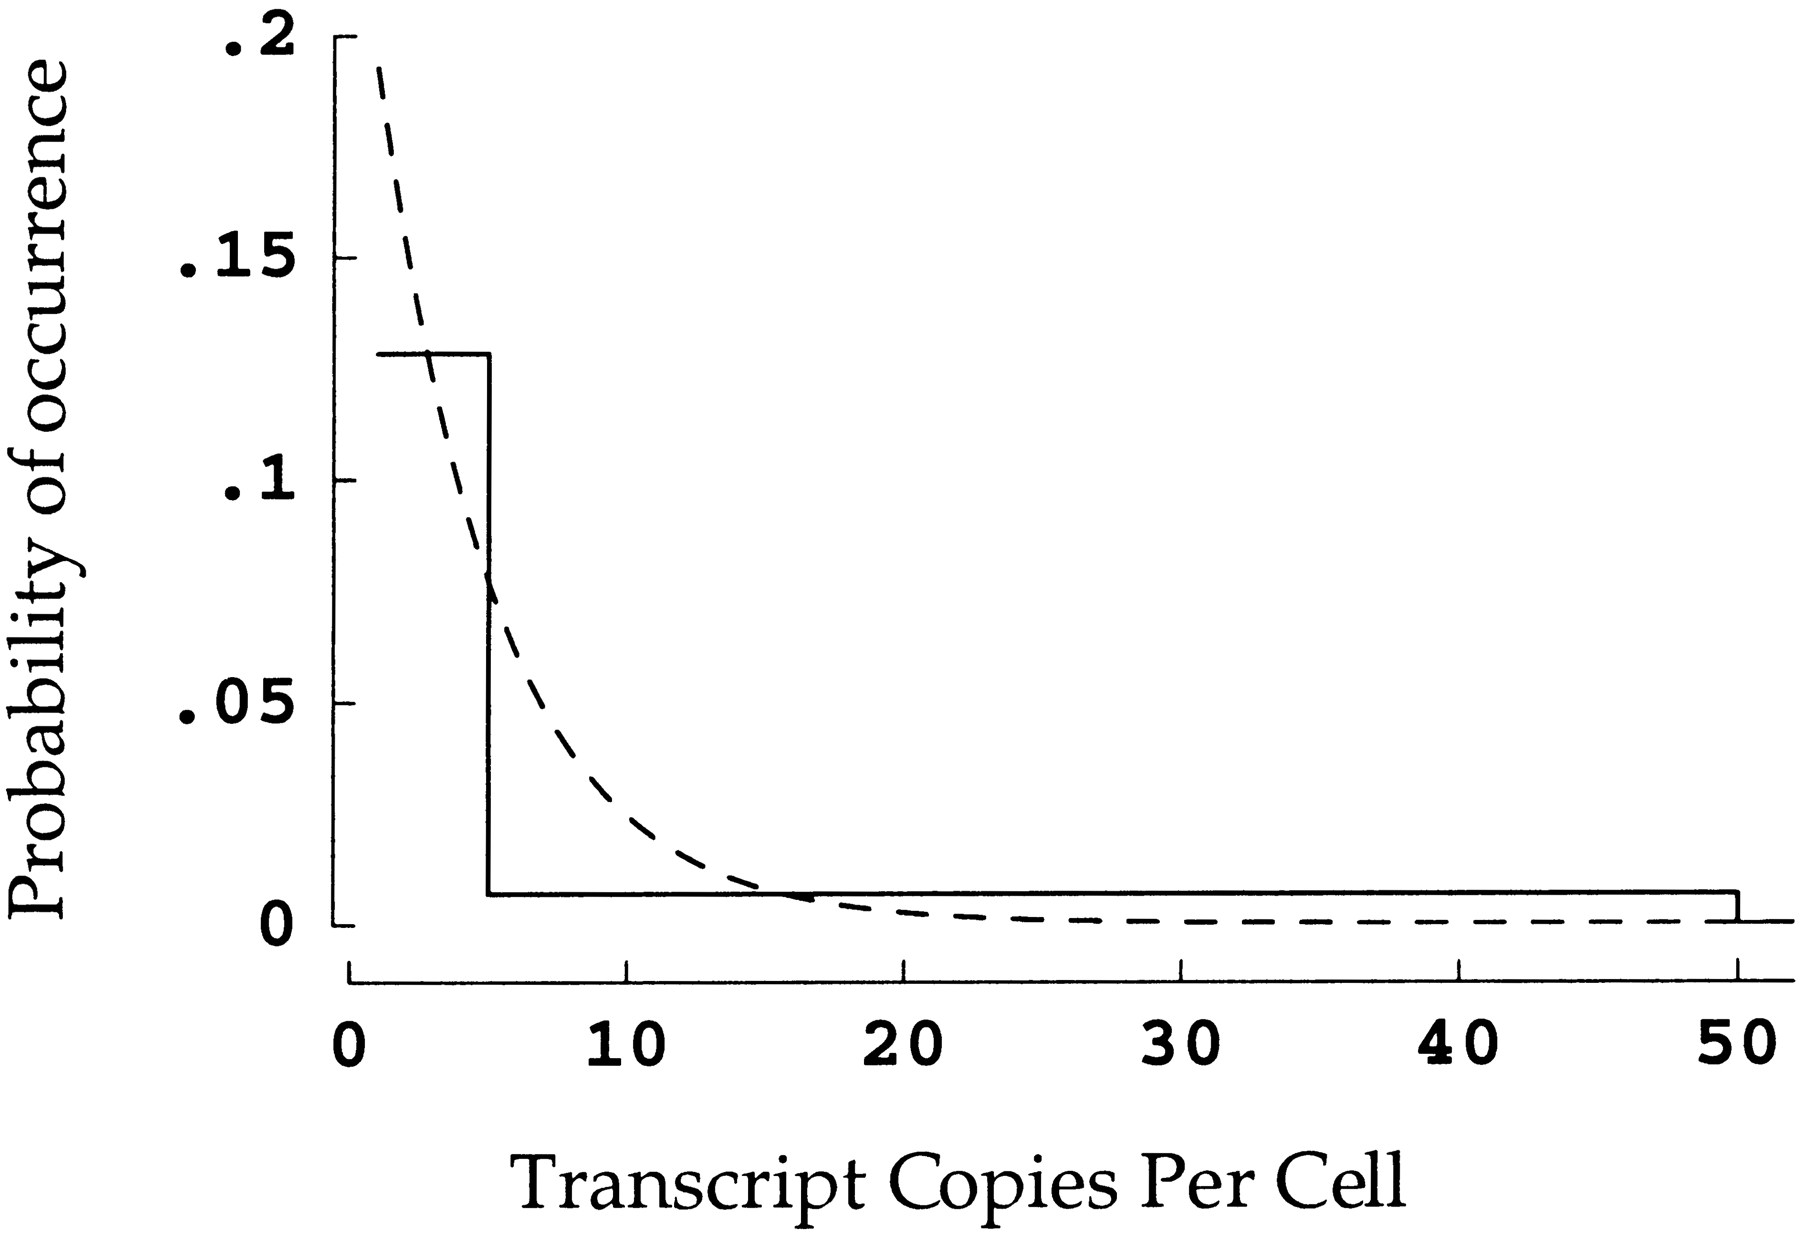
Figure 3.
Two possible forms of copy number distribution. The simplest construction is a step function (solid line). Thus, for example, if there is a 64% chance that a gene is expressed in 1 to 5 transcripts per cell, the first step extends from 1 to 5 at a height of 12.8 (64/5)%. A more plausible assumption is that the distribution is continuous. This has been implemented here by finding a double exponential function with the same integral over each copy number range (dashed line). The graph is truncated at 50 + copies per cell for visual clarity — in fact, both distributions extend out to 5000 (see Methods).