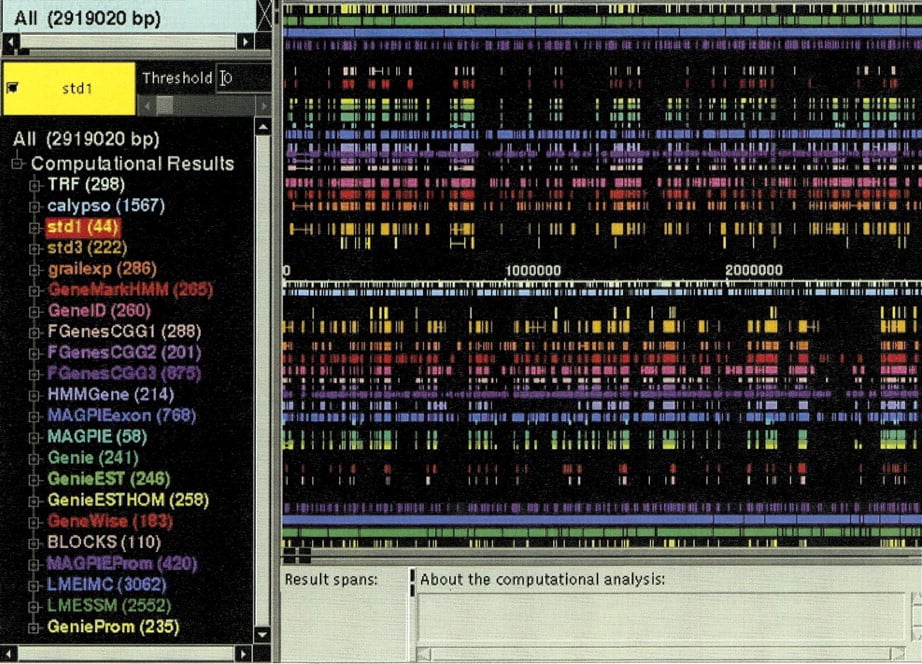
(See facing page.) Screen shot from theCloneCurator program (Harris et al. 1999), featuring the genome annotations of all 12 groups for the 2.9-Mb Adh region. The main panel shows the computational annotations on the forward (above axis) and reverse sequence strands (below axis). Genes located on the top half of each map are transcribed from distal to proximal (with respect to the telomere of chromosome are 2L); those on the bottom are transcribed from proximal to distal. Right below the axis are the two repeat finding results displayed, followed by reference sets from Ashburner et al. (1999b; std1 and std3), followed by the 12 submissions of gene-finding programs, followed by the two protein homology programs, and eventually, farthest away from the axis, the four promoter recognition programs. (Left) The color-coded legend for the program and the number of predictions made by the programs.