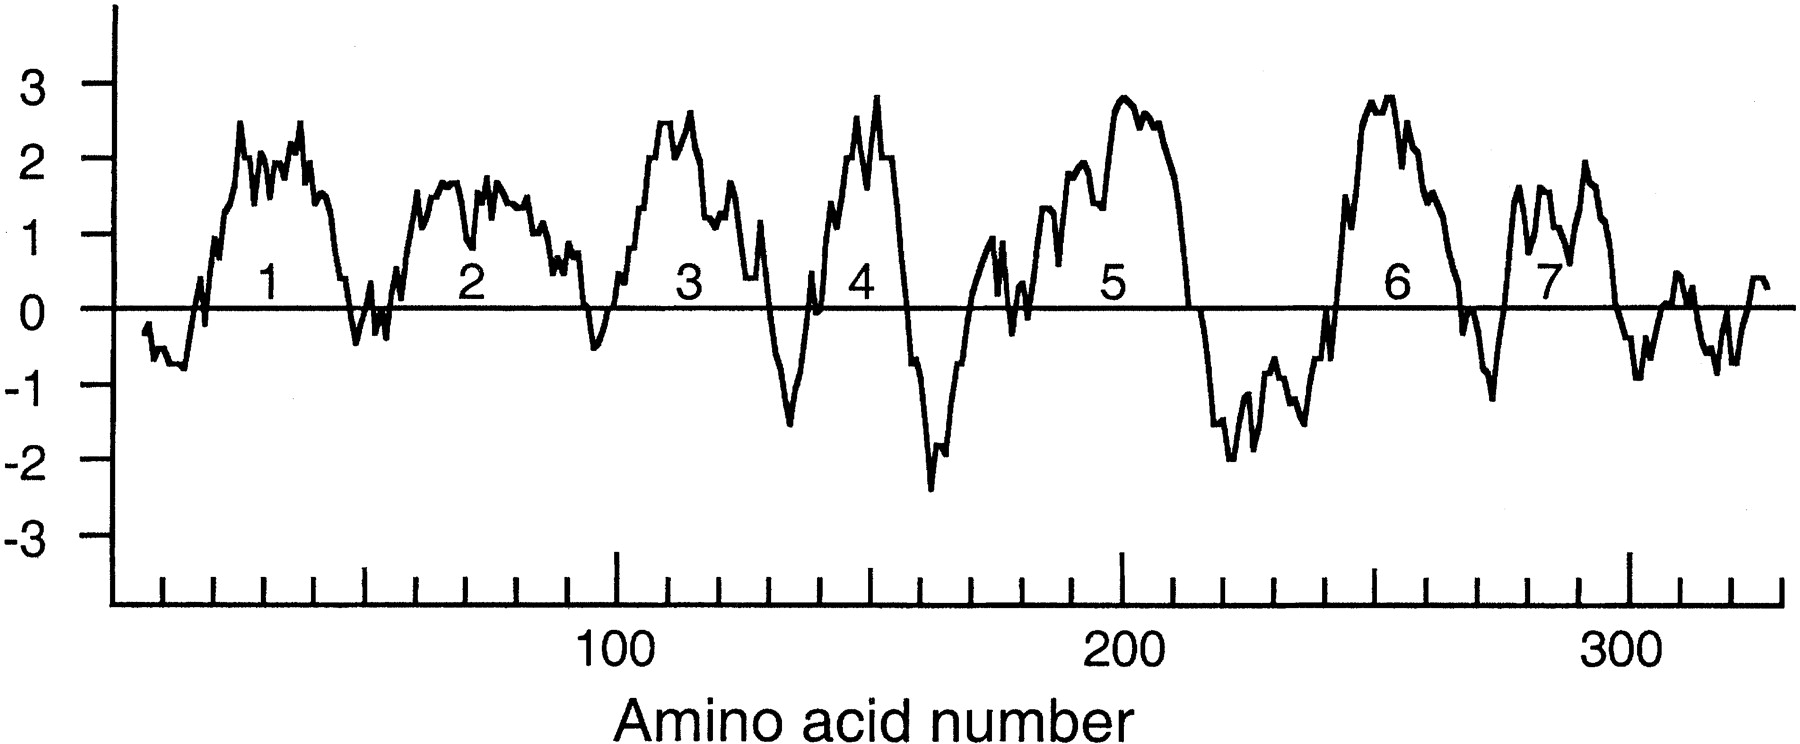
Kyte-Doolittle hydrophobicity plot for the SRH-215/T20B3.3 protein. Transmembrane regions are numbered.