Figure 1.
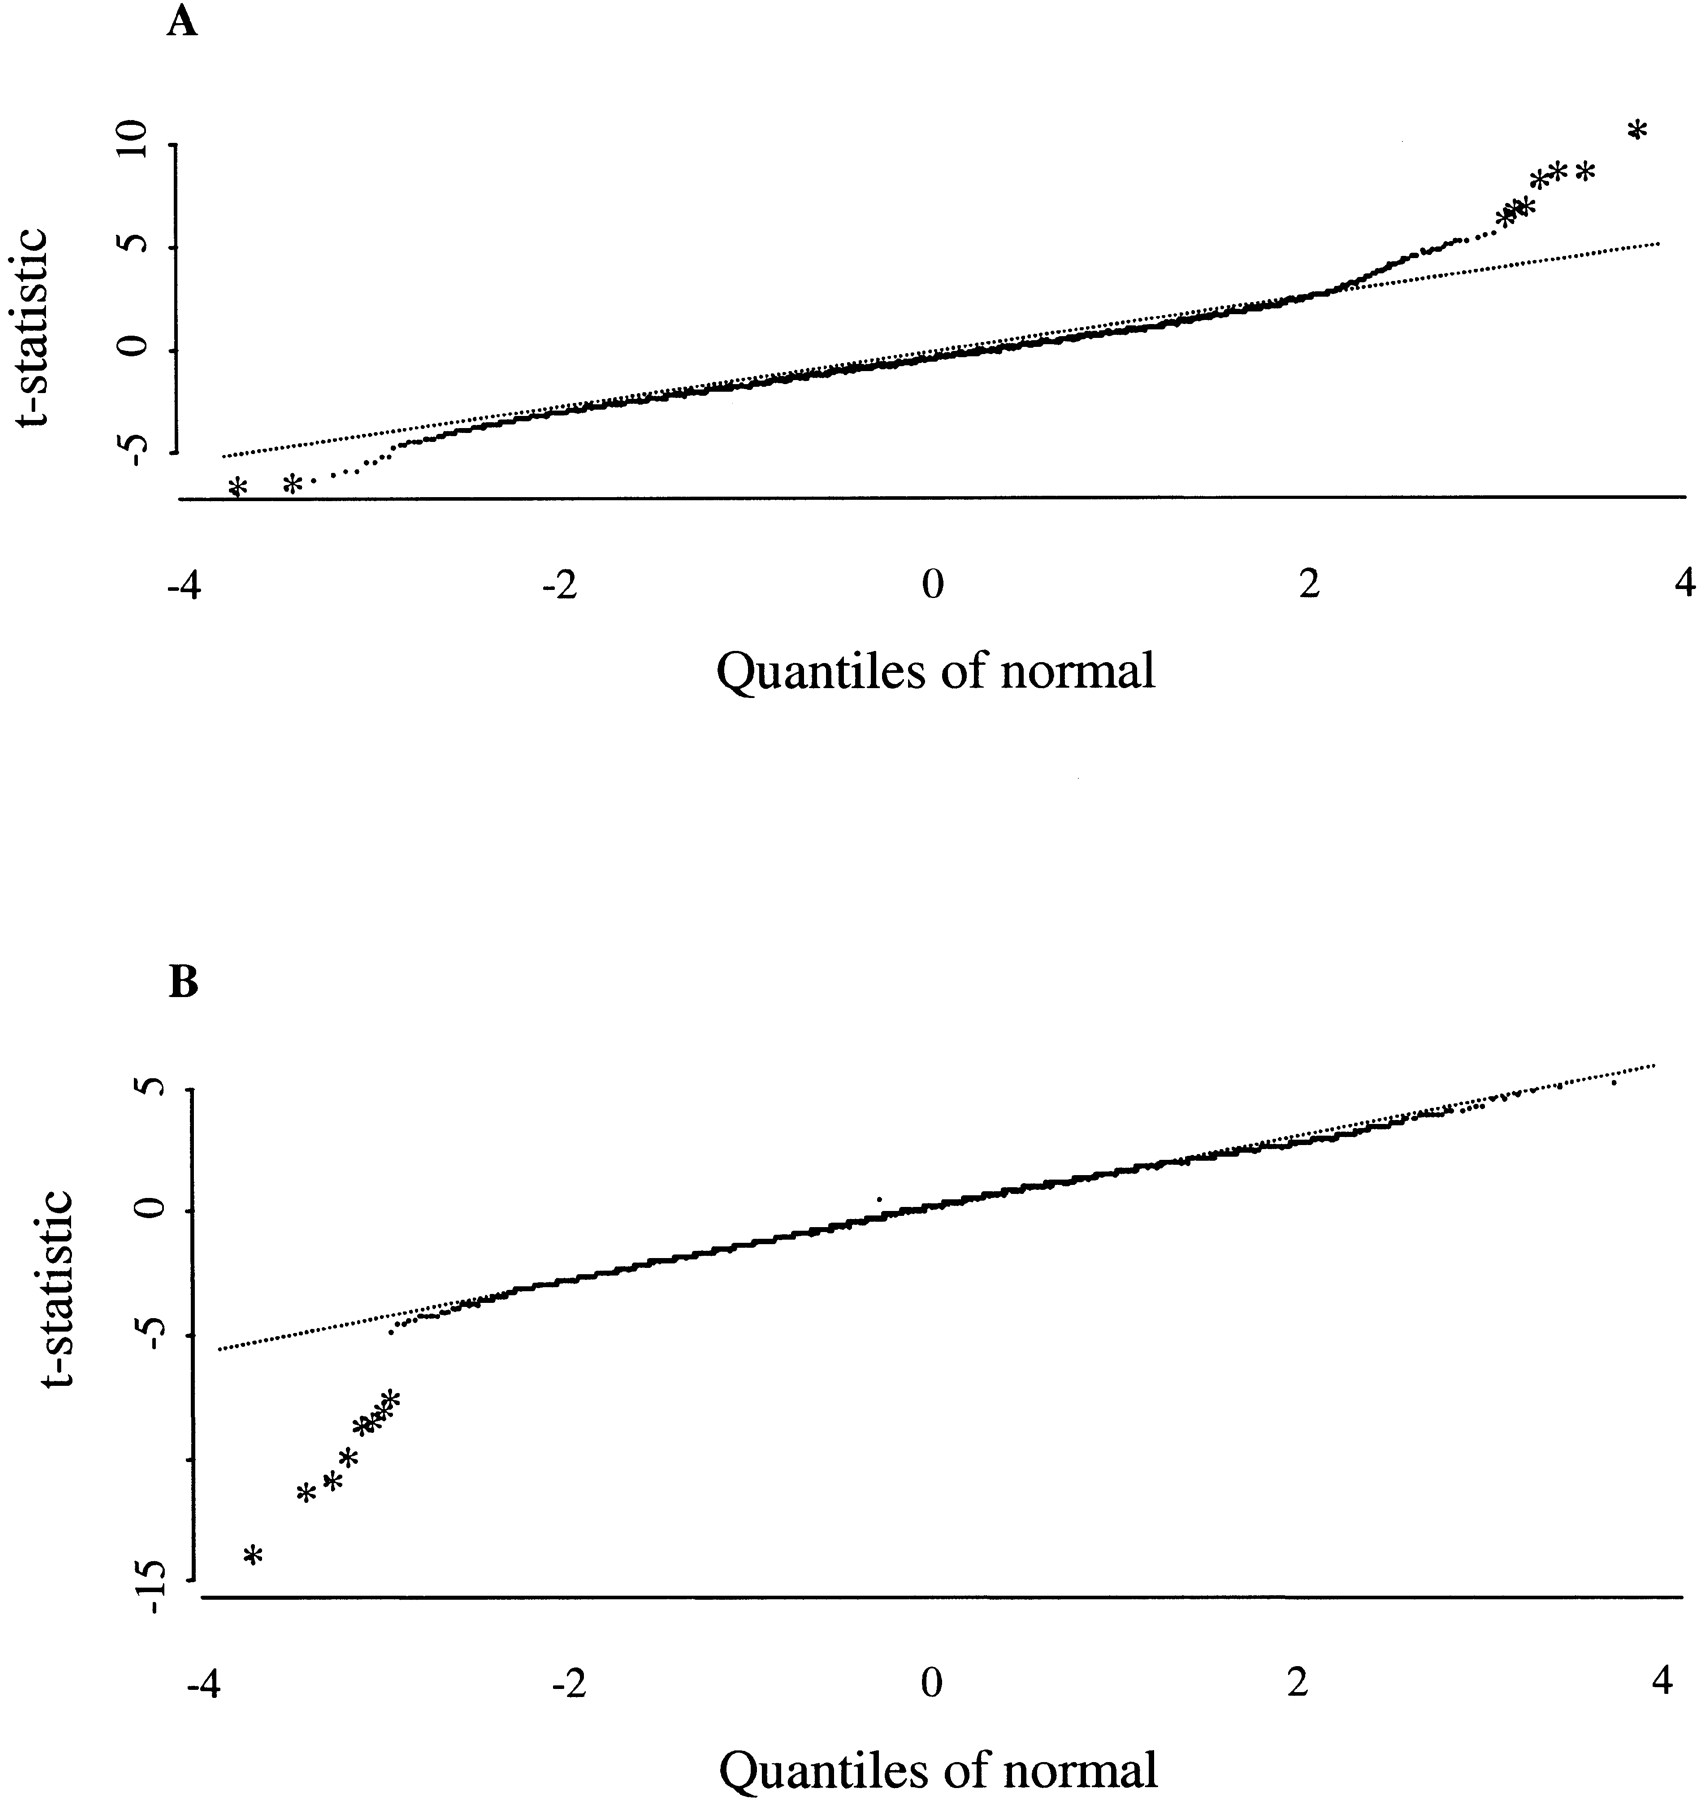
Normal quantile–quantile plot of t statistics calculated from the normalized log ratios of the SR-B1 transgenic group (A) and the apoAI-knockout group (B). Array elements with adjustedP values <0.05 are displayed with an asterisk.
Normal quantile–quantile plot of t statistics calculated from the normalized log ratios of the SR-B1 transgenic group (A) and the apoAI-knockout group (B). Array elements with adjustedP values <0.05 are displayed with an asterisk.