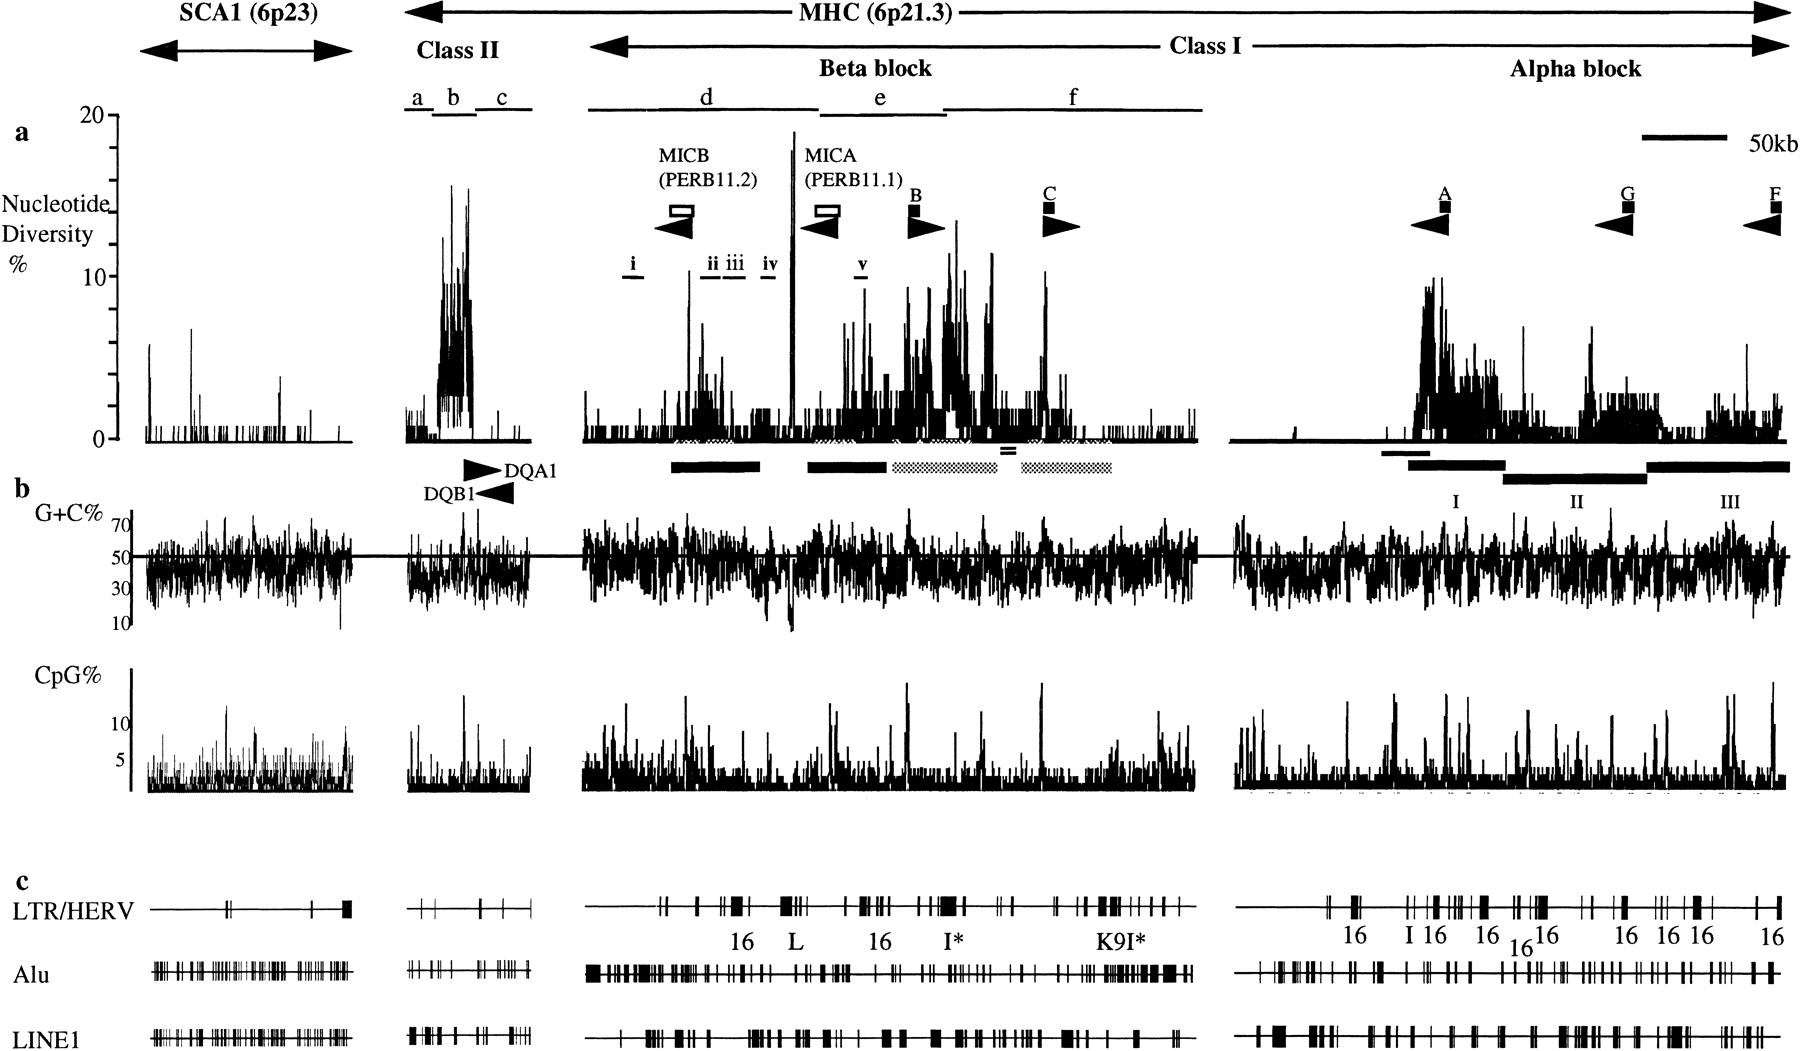
(A) SNP profiles within the human MHC and another region on 6p23 containing the polymorphic SCA1 locus. The graphs depict the level of nucleotide diversity between two human haplotypes in three continuous sequences within the class II and class I (α and β blocks) regions of the MHC and the SCA1 region on 6p23. The different haplotype comparisons within the class II region and the β block of the class I region are shown by horizontal bars and designated as a–c and d–e, respectively. The details of the comparisons are listed in Table 1. The position and transcription orientation of the HLA and MIC (PERB11) loci are shown as black and open boxes, respectively. Nucleotide diversity for each graph was calculated from a 100-nucleotide window. The position of the duplicated segments containing MIC (PERB11) genes and HLA class I genes, HLA-B and -C, are shown by black and shaded horizontal bars, respectively (Gaudieri et al. 1997a). Indels within the duplicated segments are shown by shaded circles. The 10-kb region between the HLA-B and -C segments duplicated in the telomeric region near HLA-E is indicated by a double black line. The five regions compared between different MHC haplotypes in Table 2are indicated by a thin black line and labeled as i–v. The multisegment duplications within the α block are shown as horizontal black lines and labeled I–III (Kulski et al. 1999b). (B) The G+C% and CpG% within 100-nucleotide windows are shown below the SNP profile. (C) The retroelement sequences from the LTR/HERV, Alu, and LINE1 groups are depicted below the graph. The large boxes within the HERV sequences are indicated by name below the line. The sharp increase within the α block SNP profile occurs within a cosmid and, therefore, is unlikely to be a result of a chimeric haplotype comparison (shown as a black horizontal bar below the α block (class I) SNP profile.