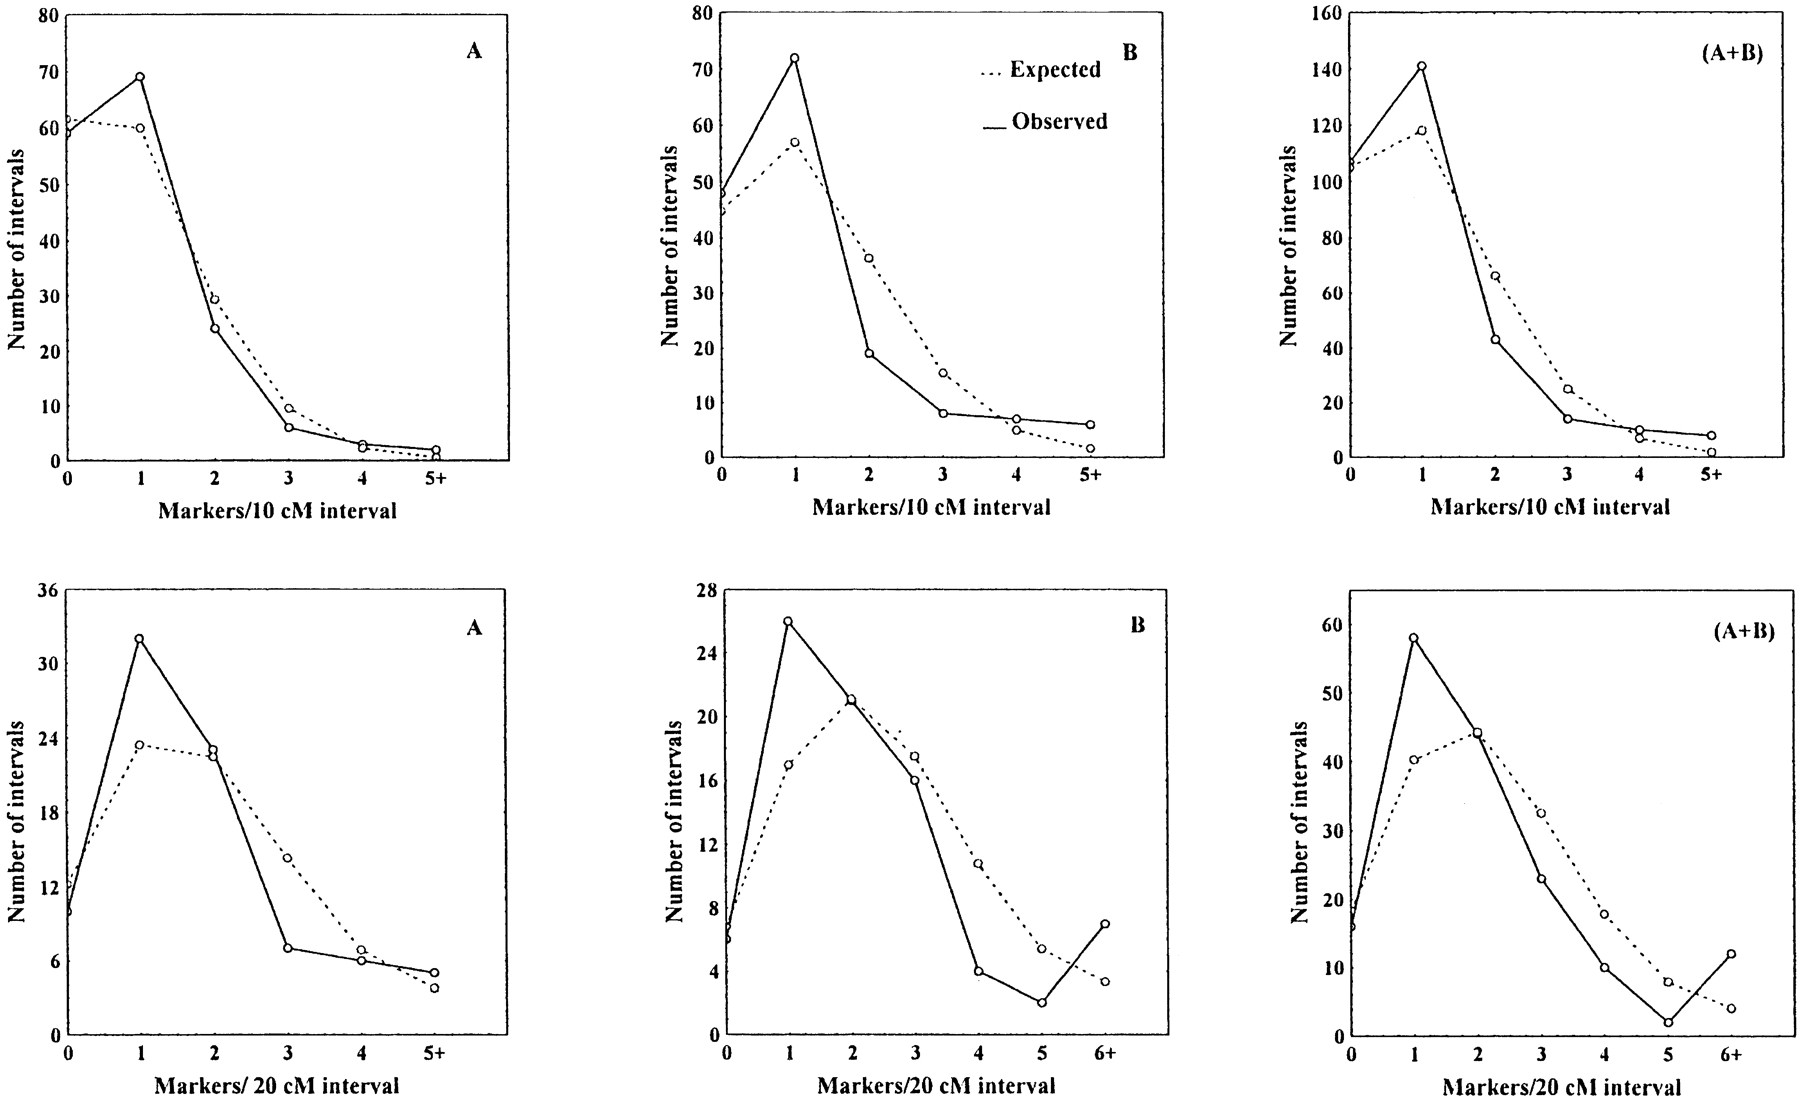
Figure 2.
Distribution of chromosome segments with respect to the number of markers per interval. Dashed lines indicate the expected (Poisson) distribution calculated by assuming no clustering; solid lines indicate the observed distribution showing a deficit of moderately populated intervals and an excess of low populated (or empty) intervals and densely populated intervals. (Panels A, B, A + B) A, B, and the entire genome, respectively.