
Abstract
Noncoding RNAs that are—like mRNAs—spliced, capped, and polyadenylated have important functions in cellular processes. The inventory of these mRNA-like noncoding RNAs (mlncRNAs), however, is incomplete even in well-studied organisms, and so far, no computational methods exist to predict such RNAs from genomic sequences only. The subclass of these transcripts that is evolutionarily conserved usually has conserved intron positions. We demonstrate here that a genome-wide comparative genomics approach searching for short conserved introns is capable of identifying conserved transcripts with a high specificity. Our approach requires neither an open reading frame nor substantial sequence or secondary structure conservation in the surrounding exons. Thus it identifies spliced transcripts in an unbiased way. After applying our approach to insect genomes, we predict 369 introns outside annotated coding transcripts, of which 131 are confirmed by expressed sequence tags (ESTs) and/or noncoding FlyBase transcripts. Of the remaining 238 novel introns, about half are associated with protein-coding genes—either extending coding or untranslated regions or likely belonging to unannotated coding genes. The remaining 129 introns belong to novel mlncRNAs that are largely unstructured. Using RT-PCR, we verified seven of 12 tested introns in novel mlncRNAs and 11 of 17 introns in novel coding genes. The expression level of all verified mlncRNA transcripts is low but varies during development, which suggests regulation. As conserved introns indicate both purifying selection on the exon–intron structure and conserved expression of the transcript in related species, the novel mlncRNAs are good candidates for functional transcripts.
A large portion of the transcriptional output of eukaryotic genomes consists of “mRNA-like noncoding RNAs” (mlncRNAs) (Maeda et al. 2006; The ENCODE Project Consortium 2007). These transcripts are capped, polyadenylated, and often spliced (sometimes alternatively spliced) just like protein-coding mRNAs, but they lack discernible open reading frames. These mlncRNAs are typically much larger than the “housekeeping” RNAs such as transfer RNA (tRNA), small nuclear RNAs (snRNAs), small nucleolar RNAs (snoRNAs), and they do not seem to have well-conserved secondary structures.
To date, molecular functions have been described only for a small minority of mlncRNAs. They act at different levels of cellular regulatory networks, employing a series of different mechanisms. Some are precursors of small RNAs (Kapranov et al. 2007; Riccardo et al. 2007; Carlile et al. 2008). For example, exons as well as introns of mlncRNAs can be processed into micro RNAs (miRNAs) (Cai and Cullen 2007; He et al. 2008), or snoRNAs (de los Santos et al. 2000; Tycowski and Steitz 2001).
Other mlncRNAs exert their function as large RNAs (Nakamura et al. 1996; Kelley and Kuroda 2000; Ginger et al. 2006). For example, the Evf-2 transcript acts as a transcriptional enhancer for distal-less homeobox genes (Faedo et al. 2004; Feng et al. 2006), related transcripts appear to have a role in the epigenetic regulation of homeotic transcription factors (Dinger et al. 2008), the hsrw RNA is key to the heat shock response in Drosophila (Arya et al. 2007), the NRON (LOC641373) transcript suppresses the transcription factor NFAT (Willingham et al. 2005), and the HOTAIR transcript is involved in transcriptional repression of the mammalian HOX-D cluster (Rinn et al. 2007). Computational studies provide evidence that a sizeable fraction of mlncRNAs is subject to purifying selection (Ponjavic et al. 2007). Many mlncRNAs are specifically expressed in cell types or developmental stages and may even have a specific localization within cells (Inagaki et al. 2005; Tupy et al. 2005; Ravasi et al. 2006; Mercer et al. 2008), suggesting that their expression is regulated and not due to transcriptional background noise. Furthermore, mlncRNAs are up- or down-regulated in human cancer cells (Calin et al. 2007). Given that transcription of noncoding regions is abundant (Manak et al. 2006), this indicates that the few well-studied examples are only the tip of the iceberg of functionally important noncoding RNAs (ncRNAs) (Amaral et al. 2008).
As a consequence of specific expression and the generally lower expression levels of mlncRNAs compared with their protein-coding counterparts (Ravasi et al. 2006), it is likely that despite large expressed sequence tag (EST) sequencing projects, we have not yet discovered the complete repertoire of ncRNAs even in the best-studied model organisms. Since a complete inventory of transcripts is a prerequisite for the comprehensive understanding of cellular regulation, a method to uncover mlncRNAs that does not depend on expression data is highly desirable.
While computational methods can identify protein-coding genes with high accuracy in genomic sequences, the identification of ncRNAs is generally more difficult (Eddy 2002). Protein-coding sequences exhibit a clear evolutionary signature (such as an excess of synonymous mutations and reading frame preserving insertions/deletions) that allows their detection by comparative genomics methods (Badger and Olsen 1999; Stark et al. 2007b). However, apart from transcriptional footprints (Glusman et al. 2006), ncRNAs generally lack such characteristic evolutionary patterns. An important subclass, which includes the housekeeping ncRNAs, has evolutionarily conserved secondary structures. These ncRNAs can be identified by methods such as RNAz (Washietl et al. 2005) and Evofold (Pedersen et al. 2006) that search for regions with an excess of mutations that maintain the secondary structure. A few specific classes of ncRNAs, in particular miRNAs and snoRNAs, can be predicted by searching for typical sequence and/or secondary structure motifs (Lai et al. 2003; Hertel and Stadler 2006; Stark et al. 2007b; Hertel et al. 2008). By design, however, all these approaches will miss ncRNAs that are unstructured or whose structure is not well conserved in evolution.
Here, we present a new approach to identify intron-containing mlncRNAs from genomic sequence data alone. Our method exploits characteristic evolutionary signatures of conserved introns. The rationale behind this approach is driven by the observation that intron positions are generally well conserved both in protein-coding RNA and ncRNA genes (Nesterova et al. 2001; Mouse Genome Sequencing Consortium 2002; Rodriguez-Trelles et al. 2006; Ponjavic et al. 2007). For example, the Drosophila hsrw ncRNA exhibits a conserved two-exon transcript structure with conserved splice sites but a high exonic sequence divergence (Garbe et al. 1989). Furthermore, changes in the exon–intron structure are largely independent of the sequence evolution of neighboring exons (Yandell et al. 2006).
The assumption underlying our approach is that a functional pair of donor (5′) and acceptor (3′) splice sites will be retained over long evolutionary timescales only if (1) the locus is transcribed into a functional transcript, and (2) accurate intron removal is necessary to produce a functional transcript. Thus, conserved introns can be employed to determine the presence of a functional transcript directly from comparative genomics data. The advantage of this approach is that we do not need to make any assumption of the transcript itself. In particular, it is irrelevant whether there is an open reading frame or significant sequence conservation, or whether the functional product arises from the intronic or the exonic part of the transcript. We assume here that the sequence of the intron itself is not conserved; hence, we focus on transcripts whose exonic parts are likely to carry the function, even though we used the intronic part for their detection.
We applied this intron-based approach to 15 insect genomes and reliably predicted novel mlncRNAs. We show that these mlncRNAs are largely unstructured and often not associated with significant sequence conservation, implying that they cannot be predicted by existing methods. Our screen also identified unannotated protein-coding genes and provides a refinement of several gene structures by identifying introns in incomplete coding or untranslated regions (UTRs). Experimental verification succeeded for 18 of 29 tested predictions. Furthermore, we showed that conserved introns imply conserved expression of the surrounding transcript in other species.
Results
Computational identification of spliced RNAs in Drosophila genomes
Our approach consists of three steps. First, we predicted introns in individual insect genomes. Second, we used genome-wide alignments to identify orthologous introns, defined here as introns that are independently predicted in at least two genomes and where both donor and acceptor sites are exactly aligned. Third, we compiled a set of evolutionary signatures that are characteristic for introns with conserved splice sites, and use machine learning to distinguish between real and false intron predictions. These steps are illustrated in Figure 1 and are detailed below.
Overview of the computational intron prediction procedure. (A) Introns are predicted using intronscan on both strands of the D. melanogaster genome, yielding a total of ∼1.4 million predictions. Independent intronscan predictions in the other insect genomes were made. (B) Only those D. melanogaster intron predictions are retained that have an orthologous prediction in at least one additional genome. (C) A support vector machine (SVM) classifier based on five features is used to distinguish positive (real introns) and negative training samples (false predictions). These features measure characteristic splice site substitutions, sequence conservation in the middle part of introns, and variation of the intron length, donor, and acceptor score between species. As indicated by the distributions, these features are highly discriminative for positive and negative samples. By using this classifier, we predict 369 conserved introns.

We chose Drosophila as a model system to test our approach for several reasons: (1) There is a sufficient number of sequenced insect genomes, which allows comparative genomics methods to annotate features such as protein-coding genes, structured RNAs, and regulatory motifs with high accuracy (Drosophila 12 Genomes Consortium 2007; Kheradpour et al. 2007; Stark et al. 2007a,b). (2) The majority (54%) of introns in Drosophila melanogaster is not longer than 81 nucleotides (nt). This length was determined as a natural cutoff between long and short introns in the literature (Mount et al. 1992; Lim and Burge 2001) and is used here as well. This simplifies the initial identification of putative introns in the genomic sequence. (3) The short introns in D. melanogaster contain basically all the information needed to identify them in pre-mature transcripts (Lim and Burge 2001). In contrast, most mammalian introns are longer (Deutsch and Long 1999), and substantial information about intron positions is contained in exons, complicating their prediction (Dewey et al. 2006).
The intronscan tool predicts short introns in premature transcript sequences by utilizing scores for the donor and acceptor splice sites, the branch point, the intron length and the sequence composition (Lim and Burge 2001). Intronscan detects short (≤81 nt) introns in D. melanogaster with an accuracy (average of sensitivity and specificity) of 94%. We benefit from this accuracy in the first step, where we applied intronscan on the entire genomic sequence, obtaining ∼1.4 million introns with a length of 40–81 nt from both strands of the D. melanogaster genome. In the same way, we predicted introns in the genomes of the other 11 sequenced Drosophila species (Drosophila 12 Genomes Consortium 2007), Anopheles gambiae (Holt et al. 2002), Tribolium castaneum (Tribolium Genome Sequencing Consortium 2008), and Apis mellifera (Fig. 1A; Honeybee Genome Sequencing Consortium 2006).
In the second step, we used genome-wide alignments to obtain conserved intron predictions. More precisely, we required that the genomic sequence of at least one other species that aligned with the intronscan prediction in D. melanogaster is an intronscan prediction in that species. This reduces the initial set by about one third to 498,231 loci (Fig. 1B). Of these, 155,446 overlap annotated protein-coding transcripts (FlyBase or RefSeq) on the same strand. These 155,446 predictions can be divided into 23,499 real introns (i.e., both splice sites are annotated in the RefSeq or FlyBase gene structures), while the annotation provides no evidence for 117,466 predictions (i.e., no splice site is annotated). We omit 14,481 predictions where only one of the two splice sites is annotated. The remaining 342,785 predictions have no overlap with any protein-coding transcript on the same strand but can overlap a transcript on the other strand. Given that only ∼17% of the predicted introns that overlap coding genes are real introns, we assumed that only a small subset of these 342,785 predictions are real introns. We therefore utilized in the next step characteristic patterns of intron evolution to get more accurate predictions.
To this end, we compiled a set consisting of 23,499 real introns (positive samples, see Supplemental Table S1) and the 117,466 false predictions (negative samples). The rationale in constructing a set of negative samples in the absence of many experimentally proven cases is that predictions that conflict with existing exon–intron annotations are enriched in false predictions. However, it should be noted that some of these negative samples might be real introns occurring in alternative splice variants or in intermediate splicing steps (Burnette et al. 2005).
Next, we used this set to define evolutionary features that discriminate between positive and negative samples (Fig. 1C). First, real splice sites often have substitutions that are consistent with the splice site consensus. For example, the nucleotide position −3 of acceptor splice sites is usually C or T, with G being extremely rare. Consistent with this preference, positive samples show more frequently C/T substitutions than negative samples. Likewise, positive and negative samples differ in the frequency of specific substitutions at positions of the donor splice site and the polypyrimidine tract. To capture this information, we determined position-specific scores for all possible substitutions for all species pairs D. melanogaster with another species. Pairwise substitution scores are more accurate because they account for species-specific nucleotide preferences at certain splice site positions, which are often correlated to the genomic A+T content (Fig. 2). Summing these scores for the donor (positions +2…+6) and acceptor splice site (positions −7…−3) gives a strong separation of positive and negative samples (Fig. 3). This approach is motivated by the codon substitution frequency model used by Lin et al. (2007) to confirm and reject protein-coding genes.
Nucleotide frequencies in splice site positions differ among insect genomes. The figure plots the nucleotide frequency difference (relative to D. melanogaster) of the 23,499 real introns for the donor positions +3…+6 and the acceptor positions −7…−3 for 14 insect species. While differences are often small, D. willistoni, T. castaneum, and A. mellifera have a strong preference for A over G at position +3 and for T over C at −3, which is still consistent with the splice site consensus (sequence logo made using http://weblogo.berkeley.edu/). These preferences correlate with the A+T content of these genomes (D. willistoni, 63%; T. castaneum, 67%; A. mellifera, 67%; compared with D. melanogaster, 58%) (Bergman et al. 2002; Honeybee Genome Sequencing Consortium 2006; Tribolium Genome Sequencing Consortium 2008). Donor position +2 is not shown due to tiny frequency differences between the two possible nucleotides (C and T).

Evaluating characteristic intron evolution. (A) Two predicted introns with orthologous intronscan predictions in other species are shown. The prediction on top exhibits several substitutions in the splice site regions that are characteristic for real introns (e.g., C-to-T substitutions at acceptor position −3). Furthermore, this prediction has a low sequence conservation within the intron (average phastCons score for the region +8…+20 and −20…−8 is only 0.002). This prediction gets a high probability for being a real intron (0.999). In contrast, the prediction at the bottom has substitutions that are inconsistent with intron evolution (e.g., A-to-G substitution at acceptor position −3), and it exhibits conservation throughout the intron (average phastCons score is 0.92). The SVM probability for being a real intron is consequently low (0.001). Positive substitution scores are shown in shades of green; negatives in shades of red. Substitution scores are only considered for the donor (positions +2…+6) and acceptor splice site (positions −7…−3). Note that the substitution scores are specific for each pair D. melanogaster with another species; thus, the same substitution with respect to different species can get different scores. (B) The distribution of the summed substitution scores (left) and the average conservation scores (right) show a substantial difference between our positive and negative samples. The position of the values of the introns from panel A are indicated. For a better visualization, the y-axis for positive and negative samples has a different scale.
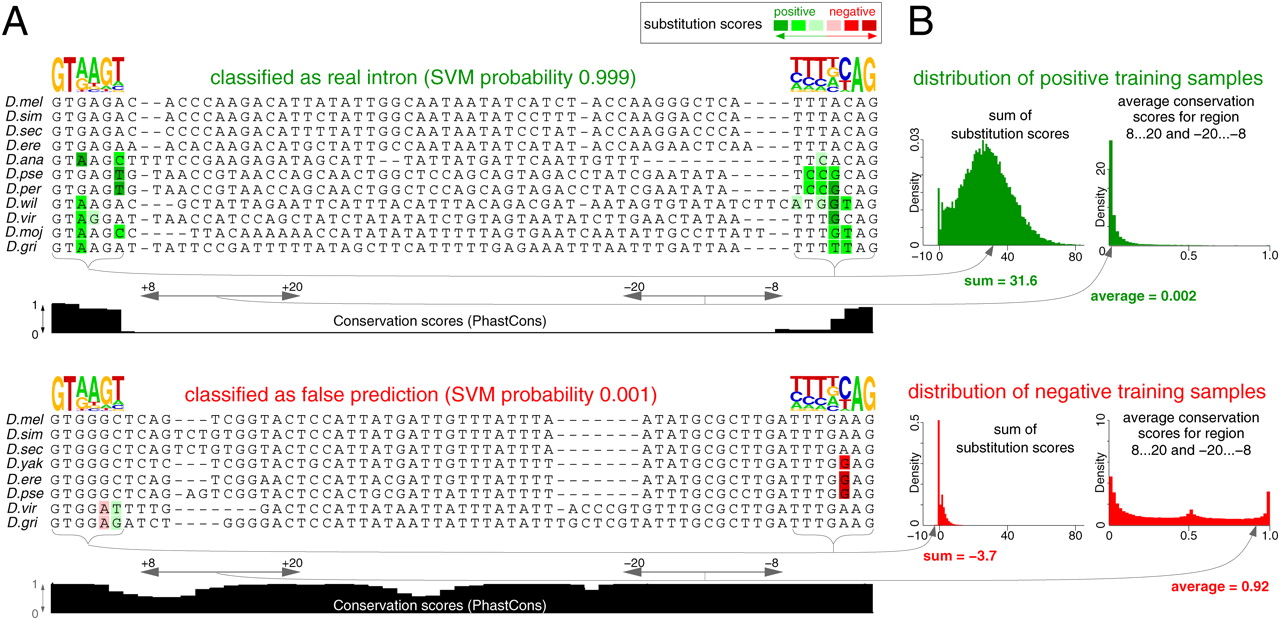
Furthermore, we observed that most positive samples exhibit a poor sequence conservation in the middle of the intron, while numerous negatives show an atypical high conservation (Fig. 3). Averaging phastCons conservation scores (Siepel et al. 2005) for the intron region +8…+20 and −20…−8 (which occurs in all introns between 40 and 81 nt) gives a highly significant difference between positives and negatives (0.056 vs. 0.425, Wilcoxon P-value < 2.2 × 10⁻¹⁶). This pattern is expected because the middle part of an intron usually contains unconstrained sequence (Halligan and Keightley 2006). Moreover, positive samples show some length variation between species (Parsch 2003), while negatives rarely do. Finally, degenerated positions in the splice site consensus leads to some variation in the sequence-based splice site scores (computed by intronscan) for positive samples, but usually not for negative samples that often have identical splice sites between species.
To combine these features into a single decision (real intron vs. false prediction), we trained a support vector machine (SVM) using randomly selected ∼95% of our set for training (22,278 positives and 111,530 negatives). On the remaining unseen 5% of the set, the SVM distinguishes between positive and negative samples with a very high accuracy (area under the receiver operating curve, 0.983) (Fig. 1C). Classifying the unseen part of the set with a probability ≥0.95 as real introns, we obtained a true positive rate of 80% (977 of 1221) at a false-positive rate of 0.12% (seven of 5936). At a probability cutoff of 0.99, we still have a true-positive rate of 71.8% (877 of 1221) at a false-positive rate of 0.07% (four of 5936). We manually examined these four false-positives and provide evidence that three of them are real introns (Supplemental Fig. S1), likely reducing the number of false-positives to just one case. The performance of the SVM is better for intron predictions located in the coding sequence (CDS) compared with introns in UTRs (Supplemental Fig. S2A). The performance difference on predicted introns that are longer or shorter than 60 nt is only marginal (Supplemental Fig. S2B). Overall, this shows that a machine learning approach based on features that capture characteristic intron evolution patterns allows a highly accurate detection of real introns among a set containing only 17% (1221 of 7157) real introns. This high accuracy is advantageous for detecting introns in the rest of the genome, where real introns are likely to be rarer than in this set.
Novel spliced transcripts
We used the SVM to evaluate the 342,785 predictions without an overlap to annotated protein-coding transcripts on the same strand to uncover novel introns and therefore novel transcripts. Using a stringent probability threshold of 0.95, we predict 369 introns (Supplemental Table S1). We searched ESTs and noncoding FlyBase transcripts and found 131 (35.5%) introns where both splice sites are transcript-confirmed, with the rest (238 cases, 64.5%) being currently unconfirmed (six of these 238 have support for either the donor or acceptor site). Of these 238 unconfirmed introns, 44 (18%) are supported by ESTs in other Drosophila species. This indicates that our approach is successful in uncovering spliced transcripts. Figure 4 shows examples of confirmed introns belonging to the 5′ UTR of a gene, to an intronic antisense transcript, to a potentially tissue-specific ncRNA, and to a structured ncRNA that represents a precursor for short interfering RNAs (siRNAs) (Okamura et al. 2008).
Examples of transcript-confirmed intron predictions. (A) A predicted intron is located in the 5′ UTR of the protein-coding gene CG14614, whose current 5′ UTR annotation consists of only 2 nt. (B) Example of a predicted intron that belongs to a transcript overlapping an intron of dally in the antisense direction. (C) Example of a predicted intron that belongs to a potentially tissue-specific noncoding RNA, as 13 of the 14 supporting ESTs originate from a salivary gland library (ESG01). (D) A predicted intron that overlaps a noncoding FlyBase transcript (pncr009:3L) that has no intron annotation. pncr009:3L was found to be a structured precursor for small interfering RNAs (Okamura et al. 2008). (E) Example of a “cluster” of three introns within ∼400 nt. All three introns are predicted with a probability of >0.999 and belong to a potentially coding gene (BLASTX hits in several Drosophila species). Examples B–E illustrate that our approach finds introns that are located in regions of low sequence conservation, indicated by low phastCons conservation scores up- and downstream of the intron. Modified UCSC genome browser (Karolchik et al. 2008) screenshots were used to make this figure.

As real transcripts usually have more than one intron, we expect that unconfirmed introns have a tendency to occur in “clusters” (Fig. 4E), defined here as a 1000-nt genomic region having at least two introns on the same strand. We found 15 clusters with two, two clusters with three, and one cluster with four unconfirmed introns. A simulation (see Methods) shows that this is significantly more than expected (empirical P-value < 0.0001), providing evidence for the existence of multi-exon transcripts.
Introns in novel coding genes and extensions of annotated genes
We observed that predicted introns have a tendency to be located closely upstream of the annotated start of a protein-coding gene. Twenty of the 238 (8.4%) unconfirmed introns are located within 100 nt upstream of a coding gene, but only 0.8% of the predictions classified as false, a 10-fold difference. Conspicuously, genes that have an unconfirmed intron closely upstream tend to have no annotated 5′ UTR (14 of 20 [70%] genes with vs. 77 of 218 [36%] genes without an intron prediction within 100 nt upstream; Fisher's exact test, P = 0.005). As shown in Figure 4A and Supplemental Figure S3, these introns often indicate an incomplete annotation of the 5′ UTR or CDS and help to narrow down the true transcription start site. We observed no comparable enrichment for the 3′ end of genes. This indicates that the annotation of the 3′ end is more complete, which is expected given that large-scale EST projects use poly-A tails to prime the reverse transcription reaction.
Next, we compared all 238 unconfirmed introns with coding gene predictions by CONTRAST (Gross et al. 2007), NSCAN (Gross and Brent 2006), and novel exons predicted by Lin et al. (2007). In addition, we used BLASTX to search for protein homology of the regions flanking these introns. All hits were manually examined. We found that 23 introns likely belong to coding region extensions of annotated genes (Table 1). Another 30 introns overlap gene predictions or BLASTX hits that have no overlap with annotated genes, indicating that these introns likely belong to novel coding genes that are missing in the current D. melanogaster genome annotation (Fig. 5). We conclude that predicted introns close to annotated genes likely belong to incomplete CDS or 5′ UTR. Our predicted introns, together with other annotation tools, thus also extend the catalog of Drosophila coding genes.
Predicted unconfirmed introns that likely belong to coding transcripts

[i] These intron predictions are unconfirmed in D. melanogaster and are likely to extend known coding genes or are located in novel coding gene predictions.
[ii] aThe orthologous intron is EST confirmed in other insects.
[iii] bBLASTX hit that flanks exactly the intron; NCBI protein identifier is given.
[iv] ccongochr* identifier of novel exons from Lin et al. (2007).
Predicted introns in novel protein-coding genes. (A) A predicted intron is consistent with a two-exon coding gene predicted by CONTRAST (Gross et al. 2007). (B) Several predicted introns overlap a coding gene model predicted by NSCAN (Gross and Brent 2006). While the two downstream introns are in agreement with the NSCAN predictions, the two upstream introns are not. However, a BLASTX run of the entire region excluding the four introns (represents the spliced transcript) gives a perfect hit with a D. melanogaster protein (SwissProt Q6IL55) as well as hits in eight other Drosophila species. The positions of the four introns and the NSCAN predicted start codon in the Q6IL55 protein sequence are indicated as dashed lines.

Novel spliced ncRNAs
In Table 1, we listed only introns that belong to coding genes with high confidence. To get a set of unconfirmed introns in likely noncoding regions, we used BLASTX again with a low threshold (E ≤ 10−5) and excluded 94 introns (including the 53 introns in Table 1). For the subsequent analysis, we also excluded nine unconfirmed introns that overlap repeats and six introns that are located on chrU, chrUextra, and chr*Het. We note that these predictions can be real, but repeats and these gap-rich genome parts are generally difficult to analyze. The remaining 129 introns are considered to be bona fide mlncRNAs (Supplemental Table S1). Twenty-nine of these 129 (22.48%) have predicted orthologous introns in species outside the Sophophora subgenus (Drosophila virilis, Drosophila mojavensis, Drosophila grimshawi), which indicates exon–intron structure conservation over 63 million years (Myr) of evolution (Tamura et al. 2004).
In contrast to the ncRNAs identified by Tupy et al. (2005), our 129 introns are flanked by regions of rather low sequence conservation (average phastCons scores for the 100 nt up- and downstream flanks are 0.25). Note that this is no indication that the predictions are not real. Indeed, the seven unconfirmed introns that we experimentally verified (see below) show an even lower flank conservation (average is 0.21). A large fraction of these 129 introns overlap coding genes in antisense direction (41 of 129; 32%); however, this is not surprising given that almost half of the D. melanogaster genome is covered by exons and introns of coding genes and the fact that many genes overlap each other on opposite strands (Misra et al. 2002).
Novel mlncRNAs are mostly unstructured
Our screen identified two introns located in known mlncRNAs with extensive secondary structures (pncr009:3L, CR32205; Fig. 4D) that function as siRNA precursors (Okamura et al. 2008). To test if our predictions are associated with conserved secondary structures, we applied RNAz to the regions flanking the 129 introns. We obtained two (1.6%) predictions of conserved secondary structures. Since RNAz has a certain false-positive rate, we used two control sets to test for enrichment or depletion of conserved structures. Five thousand randomly selected genome regions and their shuffled versions show a highly similar percentage of RNAz hits. Together with the observation that >98% of these mlncRNAs are not associated with conserved secondary structures, this indicates that our method mostly predicts unstructured mlncRNAs, which cannot be identified by RNAz and related methods.
Experimental verification of predicted mlncRNAs
We used RT-PCR with primers designed to flank the predicted intron to validate expression of the corresponding transcripts in five different developmental stages of D. melanogaster: embryo, larva, pupa, male, and female. We counted as a positive verification only those introns where the transcript is spliced and sequencing confirms the correctness of both splice sites.
We tested 12 introns that likely belong to mlncRNAs, and could verify seven (58%) of them (Fig. 6). We named these seven mlncRNAs according to their genomic location (cytogenic band). The expression level of all transcripts is low, consistent with previous findings of low expression levels of mlncRNAs (Ravasi et al. 2006). Only two of the seven mlncRNAs can be found in all five tested conditions (mlncRNA102B1 and mlncRNA42E5-2). The other five show variation in the expression pattern during development, which suggests that their expression is controlled. For example, mlncRNA36C10 is found only in embryos, mlncRNA68E3 shows only a weak expression at the pupal stage, and mlncRNA66A2 is expressed in all five conditions except for the embryo stage. MlncRNA69E2 shows two bands on the gel due to usage of an alternative acceptor splice site (Supplemental Fig. S4), and our predicted intron corresponds to the longer transcript. ESTs downstream of mlncRNA102B1 indicate that this mlncRNA belongs to a longer D. melanogaster transcript and the orthologous Drosophila yakuba intron is confirmed by a four-exon transcript (Supplemental Fig. S5).
Experimentally verified introns in mlncRNA transcripts. The expression of the spliced transcript was tested in embryo (E), larva (L), pupa (P), male (♂), and female (♀) stages. Ethidium bromide–stained agarose gels show the RT-PCR results for D. melanogaster. Expression data of the orthologous transcripts in D. simulans (D.sim), D. erecta (D.ere), and D. pseudoobscura (D.pse) are shown below the D. melanogaster (D.mel) data. Genomic DNA (gen.) was used as a PCR control, and size was measured according to a 100-bp Ladder (M). PCR products were verified by sequencing. +/++, expressed; −, no band; n.o., no orthologous intron; n.t., not tested. Weaker and stronger expression in different stages are indicated by + and ++, respectively.

Next, we tested 17 unconfirmed introns located in putative coding transcripts, and verified 11 (65%) of them (Supplemental Table S2). This shows that novel mlncRNA and coding transcripts are roughly equally likely to be verified in our experimental setup.
Overall, we verified 62% (18 of 29) of our tested predictions. As in all transcriptomic studies, this percentage represents a lower bound as we miss transcripts expressed in other conditions or at expression levels below our sensitivity.
Conserved introns are predictive of conserved transcript expression in other Drosophila species
Our approach is based on the assumption that conserved introns should be indicative of conserved transcripts, which should therefore be expressed in other Drosophila species. To test this, we determined whether the regions orthologous to the seven novel mlncRNAs are expressed in Drosophila simulans, Drosophila erecta, and Drosophila pseudoobscura, and whether the orthologous introns are correctly spliced. We used RT-PCR with primers specific for these three species and confirmed splicing of the transcript and correctness of both predicted splice sites by sequencing.
We found that five of the seven transcripts are expressed in D. erecta and D. pseudoobscura (Fig. 6; Supplemental Table S3). All seven transcripts are expressed in the closely related D. simulans. Expression of orthologous transcripts was detected in D. pseudoobscura despite the observation that the sequence up- and downstream of the intron has little similarity to D. melanogaster (Supplemental Fig. S6). It is noteworthy that the alternative acceptor of mlncRNA69E2 is used in D. simulans and D. erecta as well. Consistent with the absence of this alternative splice site in D. pseudoobscura (Supplemental Fig. S4), we detect only one D. pseudoobscura transcript. These results show that novel noncoding transcripts that are expressed in several Drosophila species can be predicted from genomic sequence alone by searching for conserved introns.
Discussion
Eukaryotic cells produce a diverse class of intron-containing transcripts including protein-coding and noncoding ones. Protein-coding genes and particular classes of ncRNAs such as tRNAs, miRNAs, and snoRNAs can be identified by comparative genomics methods. However, the detection of mlncRNAs currently relies solely on experiments (Inagaki et al. 2005; Tupy et al. 2005) since no characteristic features are known that allow their prediction.
We describe here a method that predicts intron-containing transcripts by making use of evolutionary characteristics of conserved introns and the observation that introns rarely turnover or shift with respect to the exons. It is important to note that we solely use intron information for predictions. This allows us to identify (1) protein-coding transcripts (including UTRs thereof) as well as mlncRNAs; (2) transcripts without conserved secondary structures; and (3) transcripts without evolutionarily conserved sequences (see Fig. 4). The latter property is important as functional ncRNAs do not necessarily have significantly conserved sequences (Panga et al. 2006). For example, the XIST ncRNA has a clear function in X chromosome inactivation in mammals (Kelley and Kuroda 2000); however, a comparison of human and mouse XIST reveals a low overall sequence identity (Nesterova et al. 2001).
While our approach is unbiased with respect to these characteristics, it has limitations. Our method predicts only a partial transcript structure, which in general will have to be completed by experimental approaches such as full-length cDNA sequencing. However, gene prediction algorithms that predict only the CDS and high-throughput transcriptomic techniques suffer from the same problem. Here, we focused on short introns in D. melanogaster; consequently, transcripts containing exclusively longer introns cannot be predicted. It remains unclear whether longer introns and whether short introns in other species are predictable in a similar way.
Furthermore, we currently classify introns with a conserved intron body as false, because the great majority of real introns shows no sequence conservation in the middle. Thus, introns overlapping other functional elements such as putative promoter elements (Supplemental Fig. S7), introns that are miRNA precursors (Berezikov et al. 2007; Okamura et al. 2007), or retained introns that encode a protein domain (Hiller et al. 2005) are unlikely to be predicted.
Apart from the motivation to identify novel mlncRNAs, we aimed at predicting putatively functional mlncRNAs as opposed to transcriptional noise. Despite the observation that our predictions are generally not associated with strong sequence conservation, the detection of a conserved intron indicates that the exon–intron structure is under purifying selection and that the failure to correctly excise the intron likely affects the function of the transcript. Consistent with this, mlncRNA sequences, their splice sites, and promoters show reduced substitution, insertion, and deletion rates indicative of purifying selection (Ponjavic et al. 2007). Furthermore, we showed that conserved introns imply that the respective transcripts are expressed in other flies. While conserved exon–intron structure and conserved expression indicate function, the specific functional aspects of these mlncRNAs have to be addressed in future studies.
Methods
Genomes, alignments, and data
We downloaded the following genome assemblies, alignments, and annotation tracks from the UCSC genome browser (Karolchik et al. 2008): D. melanogaster (DM3), D. simulans (droSim1), Drosophila sechellia (droSec1), D. yakuba (droYak2), D. erecta (droEre2), Drosophila ananassae (droAna3), D. pseudoobscura (DP4), Drosophila persimilis (droPer1), Drosophila willistoni (droWil1), D. virilis (droVir3), D. mojavensis (droMoj3), D. grimshawi (droGri2), A. gambiae (anoGam1), T. castaneum (triCas2), A. mellifera (apiMel3), genome-wide pairwise alignments of D. melanogaster with another insect produced by BLASTZ (Schwartz et al. 2003), FlyBase and RefSeq coding transcripts (24,090 transcripts), and FlyBase noncoding transcripts (1108 transcripts). The sequence conservation was quantified by the phastCons scores (Siepel et al. 2005) for a multiple alignment of these 15 insects. ESTs and mRNAs were downloaded from the UCSC genome browser or from GenBank.
Intron prediction with intronscan
We downloaded the intronscan program (Lim and Burge 2001) from the investigators' website ftp://hollywood.mit.edu/pub/intronscan.tar.gz and applied it to the forward and reverse strand of the entire genome of all species. We set the minimum and maximum intron length to 40 and 81 nt, respectively; used a cutoff for the overall score of 11; and used parameters for intron length (-intlen), intron composition (-intcomp), and the branch site model with a branch site probability of 0.5 (-br -pB 0.5).
Orthologous introns
To determine a set of D. melanogaster introns that have orthologous intronscan predictions, we obtained from the pairwise alignments for each intron the genomic locus (chr:start-end) and the strand in another species. Then, we checked if exactly this locus and strand correspond to an intronscan prediction in the respective species. Note that both splice sites have to be exactly aligned to get an orthologous intron, which makes this step sensitive to alignment errors. We discarded 900,708 predicted D. melanogaster introns without orthologous predictions, leaving 498,231 predictions that have between one and 14 orthologous predictions.
SVM training
To get a training set, we obtained the subset of 155,446 predictions that overlap a protein-coding FlyBase and/or RefSeq transcript. We compared these predicted introns to the exon–intron annotation of the FlyBase/RefSeq transcripts and found 23,499 predictions where both splice sites are annotated (real introns, positive samples), 14,481 predictions where only one splice site (donor or acceptor site) is annotated (these were omitted in the following), and 117,466 predictions where no splice sites are annotated (negative samples). All positive and negative samples were combined into our test set. To get an unseen part of the test set, we randomly extracted ∼5% (1221 positive and 5936 negative samples). The remaining 22,278 positives and 111,530 negatives were used as the SVM training set and for substitution score calculations.
We used the following five features: (1) the sum of all pairwise substitution scores for the region +2…+6 (positions are relative to the donor site) and −7…−3 (positions are relative to the acceptor site), (2) the average phastCons score of the region +8…+20 and −20…−8, (3) the median of all intron length differences, (4) the median of all differences of donor splice sites scores (computed by intronscan), and (5) the median of all differences of acceptor sites scores.
For feature 1, we first computed species-specific log-odds scores for each of the 10 splice site positions (+2…+6 and −7…−3) and each possible nucleotide pair (x, y) by computing log2[fpos(x, y)/fneg(x, y)]. Here, nucleotide x occurs in D. melanogaster and nucleotide y occurs in one of the other 14 species (11 Drosophila species, A. gambiae, T. castaneum, A. mellifera). We write fpos and fneg for the frequencies of an (x, y) pair in positive and negative samples, respectively. These log-odds scores were summed up for each of the 10 splice site positions (+2…+6 and −7…−3), considering only substitutions, i.e., disregarding unchanged positions. The more substitutions are consistent with splice site evolution, the higher is the total substitution score. We do not divide this sum by the number of orthologous introns since this implicitly captures the fact that positive samples have more orthologous predictions than negatives (medians 9 vs. 2).
Feature 2 captures that positive samples usually have poor sequence conservation in the middle part, leading to lower phastCons scores compared to negatives. We restrict this average to the region +8…+20 and −20…−8 since this region represents the middle part of the smallest introns in our set, which are 40 nt long. The differences in features 3 to 5 were always computed D. melanogaster vs. the orthologous intron of another species. These three features capture sequence variation at the splice sites and variation of the intron length in evolution.
We used libsvm 2.85 (http://www.csie.ntu.edu.tw/∼cjlin/libsvm/) to train a radial basis kernel on input data consisting of the five features. For training and testing, all input features were scaled to the interval [−1,+1] using svm-scale. Since training the SVM kernel on the entire training set is computationally very expensive due the large size (133,808 introns), we randomly extracted 5000 predictions and trained the kernel on them.
We extensively tested other features (such as average and position-specific phastCons scores of the donor and acceptor splice sites, standard error/deviation of donor/acceptor site scores and intron length, extending the substitution scores to positions further away from the splice sites) but found no significant improvement by adding more features or other feature combinations. It should be noted that extracting a different unseen 5% part of the test set and training on the remaining 95% leads to a similar performance.
Clustering
To determine if real introns have a tendency to occur in clusters (defined here as a 1000-nt region having at least two introns on the same strand), we used a simulation test. We controlled for the different numbers of positive and negative introns since a higher number of introns will always result in more clusters. To this end, we randomly selected from the total set of negatively predicted introns as many as there are unconfirmed positive introns (total of 238) requiring that from each pair (chr, strand) the exact number of observed positive introns is selected. We repeated this 10,000 times and counted the number of clusters in each iteration. In those 10,000 iterations, we observed a maximum number of five clusters with two introns and no cluster with three or more introns. Compared with the 15 clusters with two, two clusters with three, and one cluster with four unconfirmed introns, this gives an empirical P-value of 0.0001.
Experimental verification
We did verification experiments for a set of 29 predicted introns. Primers were designed for the region 100 nt up- and downstream of each intron using FastPCR, version 5.2.118 (http://www.biocenter.helsinki.fi/bi/programs/fastpcr.htm), with the following design options: length of 20–24 nt, 55°C–62°C annealing temperature, 45–65 GC%, overlapping primers, primer quality control, primers low complexity control, and synchronizing melting temperature for primer pair ±4°C (default for all other options). To check nonspecific primer matches, we used a BLAST (E-value 1) against the whole genome, excluding the regions flanking the intron. Since the 3′ end of a primer has to fit nearly perfectly, we kept only BLAST hits having at least 16 matches together with an 18th primer–nucleotide match. Then, we discarded all primer pairs where the forward and reverse primer have a nonspecific match at the same chromosome arm. Supplemental Table S2 lists the primers for all tested introns.
Total RNA from D. melanogaster embryos, larvae, pupae, males, and females was extracted with TRIzol (Invitrogen). After treatment with RNase-free DNase (Promega), total RNA was reverse transcribed with M-MLV reverse transcriptase (Promega). Standard fly miniprep was performed to isolate genomic DNA. Predicted primer pairs were used for PCR with PCR SuperMix (Invitrogen). PCR products were analyzed by agarose gel electrophoresis on 1.2% agarose gels, cloned in pGEM-T (Promega) and sequenced with the ABI PRISM dRhodamine Terminator Cycle Sequencing Kit (Applied Biosystems).
Introns in protein-coding genes
We downloaded the CONTRAST and NSCAN annotation from the UCSC genome browser. Annotations of predicted novel exons (Lin et al. 2007) were downloaded from http://www.broad.mit.edu/∼mlin/fly_genes/ and converted to DM3 using the UCSC liftover tool (http://genome.ucsc.edu/cgi-bin/ hgLiftOver). We compared the loci of our introns with these annotations to find cases where one or both splice sites are exactly consistent with these predictions.
We also used the NCBI BLASTX program (Altschul et al. 1990) to search the database of nonredundant protein sequences (nr) using an E-value threshold of 1 × 10⁻⁵. As query sequences we used a 200-nt sequence consisting of 100 nt from the upstream and 100 nt from the downstream intron flank. In addition, we downloaded the CDS for D. simulans, D. sechellia, D. yakuba, and D. erecta from http://rana.lbl.gov/∼venky/AAA/freeze_20061030/protein_coding_gene/GLEANR/sequence/cds and used BLAT (Kent 2002) to map these sequences to the D. melanogaster genome. All hits were manually inspected. While we did not generally exclude introns on chrU, chrUextra, and the heterochromatin regions (chr*Het) from our analysis, we excluded these introns from Table 1 since we are often not able to confirm that the protein annotation uniquely refers to this region.
Discarding repeats
We downloaded the RepeatMasker annotation of D. melanogaster from the UCSC genome browser excluding simple repeats and low complexity regions. We discarded introns that overlap a repeat with at least 10%.
RNAz
We retrieved sequence 60 nt upstream of the donor and 60 nt downstream of the acceptor site of predicted introns. After aligning these regions using ClustalW, RNAz (Washietl et al. 2005) was applied to analyze the secondary structure conservation of the resulting alignments. The concatenated 120-nt sequence fragments can be interpreted as potential splice products; 120 nt is the default input sequence length of RNAz. Several alignment preprocessing steps (control for appropriate alignment lengths [>50 nt], valid gap patterns [<25% gap characters], and a base composition inside the definition range of RNAz [GC-content >0.25 and <0.75]) were performed using the Perl script rnazWindows.pl, which is part of the RNAz package (Washietl et al. 2005). By optimizing the latter features, this script maximally chooses six sequences out of an n-way alignment to match the RNAz training scope.
As a control, we used the alignments for 5000 randomly selected genome regions and obtained 118 (2.3%) RNAz hits. After randomizing these 5000 regions by column-wise shuffling, RNAz predicted 54 (1.1%) hits. Both percentages are not significantly different from the two hits for the 129 introns (Fisher's exact test, P = 0.77 and P = 0.65, respectively).
Data availability
The genomic coordinates for the DM3 assembly, the strand, and the SVM probability of all 369 predicted introns, the 129 unconfirmed introns in putative mlncRNAs, and the 94 unconfirmed introns in putative novel coding transcripts are available in Supplemental Table S1. http://cs.stanford.edu/people/hillerm/Data/Introns_mlncRNA/ contains links to load these tables into the UCSC genome browser to view them in the context of other genome annotations. Partial sequences of experimentally confirmed novel transcripts have been deposited in GenBank under accession numbers FJ528666–FJ528673 and FJ845365–FJ845382.
Acknowledgments
We thank Aaron Wenger for critical reading of the manuscript. This work was supported by the German Research Foundation (STA 850/7-1 [under the auspices of SPP-1258 “Sensory and Regulatory RNAs in Prokaryotes”] and Hi 1423/2-1), the Graduierten-Kolleg Wissensrepräsentation at the University of Leipzig, SFB610, the European Network of Excellence “The Epigenome,” and the 6th Framework Programme of the European Union (project SYNLET, 043312).
References
- ↵SF AltschulW GishW MillerEW MyersDJ Lipman(1990) Basic local alignment search tool. J Mol Biol 215:403–410.
- ↵PP AmaralME DingerTR MercerJS Mattick(2008) The eukaryotic genome as an RNA machine. Science 319:1787–1789.
- ↵R AryaM MallikSC Lakhotia(2007) Heat shock genes: Integrating cell survival and death. J Biosci 32:595–610.
- ↵JH BadgerGJ Olsen(1999) Critica: Coding region identification tool invoking comparative analysis. Mol Biol Evol 16:512–524.
- ↵E BerezikovW-J ChunJ WilliE CuppeEC La(2007) Mammalian mirtron genes. Mol Cell 28:328–336.
- ↵CM BergmanBD PfeifferDE Rincón-LimasRA HoskinsA GnirkeCJ MungallAM WangB KronmillerJ PaclebS Park(2002) Assessing the impact of comparative genomic sequence data on the functional annotation of the Drosophila genome. Genome Biol 3:RESEARCH0086, 10.1186/gb-2002-3-12-research0086.
- ↵JM BurnetteE Miyamoto-SatoMA SchaubJ ConklinAJ Lopez(2005) Subdivision of large introns in Drosophila by recursive splicing at nonexonic elements. Genetics 170:661–674.
- ↵X CaiBR Cullen(2007) The imprinted H19 noncoding RNA is a primary microRNA precursor. RNA 13:313–316.
- ↵GA CalinCG LiuM FerracinT HyslopR SpizzoC SevignaniM FabbriA CimminoEJ LeeSE Wojcik(2007) Ultraconserved regions encoding ncRNAs are altered in human leukemias and carcinomas. Cancer Cell 12:215–229.
- ↵M CarlileP NalbantK Preston-FayersGS McHaffieA Werner(2008) Processing of naturally occurring sense/antisense transcripts of the vertebrate Slc34a gene into short RNAs. Physiol Genomics 34:95–100.
- ↵T de los SantosJ SchweizerCA ReesU Francke(2000) Small evolutionarily conserved RNA, resembling C/D box small nucleolar RNA, is transcribed from PWCR1, a novel imprinted gene in the Prader-Willi deletion region, which is highly expressed in brain. Am J Hum Genet 67:1067–1082.
- ↵M DeutschM Long(1999) Intron-exon structures of eukaryotic model organisms. Nucleic Acids Res 27:3219–3228.
- ↵CN DeweyIB RogozinEV Koonin(2006) Compensatory relationship between splice sites and exonic splicing signals depending on the length of vertebrate introns. BMC Genomics 7:311, 10.1186/1471-2164-7-311.
- ↵ME DingerPP AmaralTR MercerKC PangSJ BruceBB GardinerME Askarian-AmiriK RuG SoldàC Simons(2008) Long noncoding RNAs in mouse embryonic stem cell pluripotency and differentiation. Genome Res 18:1433–1445.
- ↵Drosophila 12 Genomes Consortium (2007) Evolution of genes and genomes on the Drosophila phylogeny. Nature 450:203–218.
- ↵SR Eddy(2002) Computational genomics of noncoding RNA genes. Cell 109:137–140.
- ↵The ENCODE Project Consortium (2007) Identification and analysis of functional elements in 1% of the human genome by the ENCODE pilot project. Nature 447:799–816.
- ↵A FaedoJC QuinnP StoneyJE LongC DyeM ZolloJ RubensteinD PriceA Bulfone(2004) Identification and characterization of a novel transcript down-regulated in Dlx1/Dlx2 and up-regulated in Pax6 mutant telencephalon. Dev Dyn 231:614–620.
- ↵J FengC BiBS ClarkR MadyP ShahJD Kohtz(2006) The Evf-2 noncoding RNA is transcribed from the Dlx-5/6 ultraconserved region and functions as a Dlx-2 transcriptional coactivator. Genes & Dev 20:1470–1484.
- ↵JC GarbeWG BendenaML Pardue(1989) Sequence evolution of the Drosophila heat shock locus hsrw I. The nonrepeated portion of the gene. Genetics 122:403–415.
- ↵MR GingerAN ShoreA ContrerasM RijnkelsJ MillerMF Gonzalez-RimbauJM Rosen(2006) A noncoding RNA is a potential marker of cell fate during mammary gland development. Proc Natl Acad Sci 103:5781–5786.
- ↵G GlusmanS QinMR El-GewelyAF SiegelJC RoachL HoodAFA Smit(2006) A third approach to gene prediction suggests thousands of additional human transcribed regions. PLoS Comput Biol 2:e18, 10.1371/journal.pcbi.0020018.
- ↵SS GrossMR Brent(2006) Using multiple alignments to improve gene prediction. J Comput Biol 13:379–393.
- ↵SS GrossCB DoM SirotaS Batzoglou(2007) CONTRAST: A discriminative, phylogeny-free approach to multiple informant de novo gene prediction. Genome Biol 8:R269, 10.1186/gb-2007-8-12-r269.
- ↵DL HalliganPD Keightley(2006) Ubiquitous selective constraints in the Drosophila genome revealed by a genome-wide interspecies comparison. Genome Res 16:875–884.
- ↵S HeH SuC LiuG SkogerbøH HeD HeX ZhuT LiuY ZhaoR Chen(2008) MicroRNA-encoding long noncoding RNAs. BMC Genomics 21:236, 10.1186/1471-2164-9-236.
- ↵J HertelPF Stadler(2006) Hairpins in a haystack: Recognizing microRNA precursors in comparative genomics data. Bioinformatics 22:e197–e202.
- ↵J HertelIL HofackerPF Stadler(2008) snoReport: Computational identification of snoRNAs with unknown targets. Bioinformatics 24:158–164.
- ↵M HillerK HuseM PlatzerR Backofen(2005) Non-EST based prediction of exon skipping and intron retention events using Pfam information. Nucleic Acids Res 33:5611–5621.
- ↵RA HoltGM SubramanianA HalpernGG SuttonR CharlabDR NusskernP WinckerAG ClarkJM RibeiroR Wides(2002) The genome sequence of the malaria mosquito Anopheles gambiae. Science 298:129–149.
- ↵Honeybee Genome Sequencing Consortium (2006) Insights into social insects from the genome of the honeybee Apis mellifera. Nature 443:931–949.
- ↵S InagakiK NumataT KondoM TomitaK YasudaA KanaiY Kageyama(2005) Identification and expression analysis of putative mRNA-like noncoding RNA in Drosophila. Genes Cells 10:1163–1173.
- ↵P KapranovJ ChengS DikeDA NixR DuttaguptaAT WillinghamPF StadlerJ HertelJ HackermüllerIL Hofacker(2007) RNA maps reveal new RNA classes and a possible function for pervasive transcription. Science 316:1484–1488.
- ↵D KarolchikRM KuhnR BaertschGP BarberH ClawsonM DiekhansB GiardineRA HarteAS HinrichsF Hsu(2008) The UCSC Genome Browser Database: 2008 update. Nucleic Acids Res 36:D773–D779.
- ↵RL KelleyMI Kuroda(2000) Noncoding RNA genes in dosage compensation and imprinting. Cell 103:9–12.
- ↵WJ Kent(2002) BLAT: The BLAST-like alignment tool. Genome Res 12:656–664.
- ↵P KheradpourA StarkS RoyM Kellis(2007) Reliable prediction of regulator targets using 12 Drosophila genomes. Genome Res 17:1919–1931.
- ↵EC LaiP TomancakRW WilliamsGM Rubin(2003) Computational identification of Drosophila microrna genes. Genome Biol 4:R42, 10.1186/gb-2003-4-7-r42.
- ↵LP LimCB Burge(2001) A computational analysis of sequence features involved in recognition of short introns. Proc Natl Acad Sci 98:11193–11198.
- ↵MF LinJW CarlsonMA CrosbyBB MatthewsC YuS ParkKH WanAJ SchroederLS GramatesSE St Pierre(2007) Revisiting the protein-coding gene catalog of Drosophila melanogaster using 12 fly genomes. Genome Res 17:1823–1836.
- ↵N MaedaT KasukawaR OyamaJ GoughM FrithPG EngströmB LenhardRN AturaliyaS BatalovKW Beisel(2006) Transcript annotation in FANTOM3: Mouse gene catalog based on physical cDNAs. PLoS Genet 2:e62, 10.1371/journal.pgen.0020062.
- ↵JR ManakS DikeV SementchenkoP KapranovF BiemarJ LongJ ChengI BellS GhoshA Piccolboni(2006) Biological function of unannotated transcription during the early development of Drosophila melanogaster. Nat Genet 38:1151–1158.
- ↵TR MercerME DingerSM SunkinMF MehlerJS Mattick(2008) Specific expression of long noncoding RNAs in the mouse brain. Proc Natl Acad Sci 105:716–721.
- ↵S MisraMA CrosbyCJ MungallBB MatthewsKS CampbellP HradeckyY HuangJS KaminkerGH MillburnSE Prochnik(2002) Annotation of the drosophila melanogaster euchromatic genome: A systematic review. Genome Biol 3:RESEARCH0083, 10.1186/gb-2002-3-12-research0083.
- ↵SM MountC BurksG HertzGD StormoO WhiteC Fields(1992) Splicing signals in drosophila: Intron size, information content, and consensus sequences. Nucleic Acids Res 20:4255–4262.
- ↵Mouse Genome Sequencing Consortium (2002) Initial sequencing and comparative analysis of the mouse genome. Nature 420:520–562.
- ↵A NakamuraR AmikuraM MukaiS KobayashiPF Lasko(1996) Requirement for a noncoding RNA in Drosophila polar granules for germ cell establishment. Science 274:2075–2079.
- ↵TB NesterovaSY SlobodyanyukEA ElisaphenkoAI ShevchenkoC JohnstonME PavlovaIB RogozinNN KolesnikovN BrockdorffSM Zakian(2001) Characterization of the genomic Xist locus in rodents reveals conservation of overall gene structure and tandem repeats but rapid evolution of unique sequence. Genome Res 11:833–849.
- ↵K OkamuraJW HagenH DuanDM TylerEC Lai(2007) The mirtron pathway generates microRNA-class regulatory RNAs in Drosophila. Cell 130:89–100.
- ↵K OkamuraW-J ChungJG RubyH GuoDP BartelEC Lai(2008) The Drosophila hairpin RNA pathway generates endogenous short interfering RNAs. Nature 453:803–806.
- ↵KC PangaMC FrithaJS Mattick(2006) Rapid evolution of noncoding RNAs: Lack of conservation does not mean lack of function. Trends Genet 22:1–5.
- ↵J Parsch(2003) Selective constraints on intron evolution in Drosophila. Genetics 165:1843–1851.
- ↵JS PedersenG BejeranoA SiepelK RosenbloomK Lindblad-TohES LanderJ KentW MillerD Haussler(2006) Identification and classification of conserved RNA secondary structures in the human genome. PLoS Comput Biol 2:e33, 10.1371/journal.pcbi.0020033.
- ↵J PonjavicCP PontingG Lunter(2007) Functionality or transcriptional noise? Evidence for selection within long noncoding RNAs. Genome Res 17:556–565.
- ↵T RavasiH SuzukiKC PangS KatayamaM FurunoR OkunishiS FukudaK RuMC FrithMM Gongora(2006) Experimental validation of the regulated expression of large numbers of noncoding RNAs from the mouse genome. Genome Res 16:11–19.
- ↵S RiccardoG TortorielloE GiordanoM TuranoM Furia(2007) The coding/non-coding overlapping architecture of the gene encoding the Drosophila pseudouridine synthase. BMC Mol Biol 8:15, 10.1186/1471-2199-8-15.
- ↵JL RinnM KerteszJK WangSL SquazzoX XuSA BrugmannLH GoodnoughJA HelmsPJ FarnhamE Segal(2007) Functional demarcation of active and silent chromatin domains in human HOX loci by noncoding RNAs. Cell 29:1311–1323.
- ↵F Rodriguez-TrellesR TarroFJ Ayala(2006) Origin and evolution of spliceosomal introns. Annu Rev Genet 40:47–76.
- ↵S SchwartzWJ KentA SmitZ ZhangR BaertschRC HardisonD HausslerW Miller(2003) Human-mouse alignments with BLASTZ. Genome Res 13:103–107.
- ↵A SiepelG BejeranoJS PedersenAS HinrichsM HouK RosenbloomH ClawsonJ SpiethLW HillierS Richards(2005) Evolutionarily conserved elements in vertebrate, insect, worm, and yeast genomes. Genome Res 15:1034–1050.
- ↵A StarkP KheradpourL PartsJ BrenneckeE HodgesGJ HannonM Kellis(2007a) Systematic discovery and characterization of fly microRNAs using 12 Drosophila genomes. Genome Res 17:1865–1879.
- ↵A StarkMF LinP KheradpourJS PedersenL PartsJW CarlsonMA CrosbyMD RasmussenS RoyAN Deoras(2007b) Discovery of functional elements in 12 Drosophila genomes using evolutionary signatures. Nature 450:219–232.
- ↵K TamuraS SubramanianS Kumar(2004) Temporal patterns of fruit fly (Drosophila) evolution revealed by mutation clocks. Mol Biol Evol 21:36–44.
- ↵Tribolium Genome Sequencing Consortium (2008) The genome of the model beetle and pest Tribolium castaneum. Nature 452:949–955.
- ↵JL TupyAM BaileyG DaileyM Evans-HolmCW SiebelS MisraSE CelnikerGM Rubin(2005) Identification of putative noncoding polyadenylated transcripts in Drosophila melanogaster. Proc Natl Acad Sci 102:5495–5500.
- ↵KT TycowskiJA Steitz(2001) Noncoding snoRNA host genes in Drosophila: expression strategies for modification guide snoRNAs. Eur J Cell Biol 80:119–125.
- ↵S WashietlIL HofackerPF Stadler(2005) Fast and reliable prediction of noncoding RNAs. Proc Natl Acad Sci 102:2454–2459.
- ↵AT WillinghamAP OrthS BatalovEC PetersBG WenP Aza-BlancJB HogeneschPG Schultz(2005) A strategy for probing the function of noncoding RNAs finds a repressor of NFAT. Science 309:1570–1573.
- ↵M YandellCJ MungallC SmithS ProchnikJ KaminkerG HartzellS LewisGM Rubin(2006) Large-scale trends in the evolution of gene structures within 11 animal genomes. PLoS Comput Biol 2:e15, 10.1371/journal.pcbi.0020015.
Notes
[5] [Supplemental material is available online at www.genome.org. Partial sequences of experimentally confirmed novel transcripts have been deposited in GenBank (http://www.ncbi.nlm.nih.gov/Genbank/) under accession nos. FJ528666–FJ528673 and FJ845365–FJ845382.]
[6] Article published online before print. Article and publication date are at http://www.genome.org/cgi/doi/10.1101/gr.090050.108.