
Abstract
Integration of retroviral DNA into host cell DNA is a defining feature of retroviral replication. HIV integration is known to be favored in active transcription units, which promotes efficient transcription of the viral genes, but the molecular mechanisms responsible for targeting are not fully clarified. Here we used pyrosequencing to map 40,569 unique sites of HIV integration. Computational prediction of nucleosome positions in target DNA indicated that integration sites are periodically distributed on the nucleosome surface, consistent with favored integration into outward-facing DNA major grooves in chromatin. Analysis of integration site positions in the densely annotated ENCODE regions revealed a wealth of new associations between integration frequency and genomic features. Integration was particularly favored near transcription-associated histone modifications, including H3 acetylation, H4 acetylation, and H3 K4 methylation, but was disfavored in regions rich in transcription-inhibiting modifications, which include H3 K27 trimethylation and DNA CpG methylation. Statistical modeling indicated that effects of histone modification on HIV integration were partially independent of other genomic features influencing integration. The pyrosequencing and bioinformatic methods described here should be useful for investigating many aspects of retroviral DNA integration.
To replicate, a retrovirus must integrate a DNA copy of its RNA genome into a chromosome of the host cell. The selection of cellular integration acceptor sites is crucial for both the retrovirus and the host (for reviews, see Coffin et al. 1997; Bushman 2001). For the virus, selection of favorable integration target sites is required for efficient viral gene expression (Jordan et al. 2003; Bisgrove et al. 2005; Lewinski et al. 2005). For the host, integration can cause adverse events such as activation of proto-oncogenes or inactivation of required cellular genes.
Insertional activation of oncogenes has been seen in a human gene therapy trial, in which integration of a therapeutic retroviral vector near the LMO2 proto-oncogene contributed to transformation in several patients (Hacein-Bey-Abina et al. 2003a, b). These adverse events have focused intense interest on the mechanisms mediating retroviral integration site selection.
The host cell DNA sequences hosting integration events show detectable but modest similarity to one another—thus retroviral DNA integration is not tightly sequence-specific (Stevens and Griffith 1996; Carteau et al. 1998; Holman and Coffin 2005; Wu et al. 2005; Berry et al. 2006). However, integration site selection in vivo is not random. HIV favors integration within active transcription units (Schroder et al. 2002; Wu et al. 2003; Mitchell et al. 2004; Barr et al. 2005, 2006; Ciuffi et al. 2005, 2006b; Lewinski et al. 2005, 2006). One cellular factor involved in HIV targeting is the PSIP1/LEDGF/p75 protein, which is known to bind HIV integrase tightly and is required for efficient HIV infection (Cherepanov et al. 2003; Maertens et al. 2003; Llano et al. 2004a, b; 2006; Turlure et al. 2004; Bushman et al. 2005; Vandegraaff et al. 2006). When PSIP1/LEDGF/p75 was depleted from cells using RNA interference, integration in transcription units was diminished, documenting a role in integration targeting (Ciuffi et al. 2005). PSIP1/LEDGF/p75-responsive genes were identified by transcriptional profiling and found to be favored integration targets for both HIV (Ciuffi et al. 2005; Berry et al. 2006) and another lentivirus, feline immunodeficiency virus (Kang et al. 2006). However, in cells depleted for PSIP1/LEDGF/p75, HIV integration was still favored in transcription units. Thus additional factors may be involved in guiding HIV integration (Ciuffi et al. 2005).
Several studies have suggested that the substrate for integration in vivo may be DNA bound on nucleosomes. Favored integration sites for MLV in SV40 DNA measured in vivo were shown to match more closely to in vitro integration data for nucleosomal SV40 DNA than naked SV40 DNA, supporting the idea that nucleosome-associated DNA was the target in vivo (Pryciak et al. 1992). In vitro, DNA wrapped in nucleosomes is favored for integration compared with naked DNA (Pryciak and Varmus 1992; Pruss et al. 1994b; Taganov et al. 2004). Analysis of integration patterns in vitro indicated that outward-facing DNA major grooves were favored target sites (Pruss et al. 1994a, b). However, whether integration in host-cell chromosomal DNA takes place in nucleosome-wrapped DNA has not previously been studied.
Here we present a study of integration site selection by HIV, taking advantage of massively parallel DNA sequencing based on pyrophosphate release (“pyrosequencing”) (Margulies et al. 2005) to determine 40,569 unique integration site sequences. This data set is ∼50-fold larger than any previously studied, allowing us to analyze several previously inaccessible aspects of integration site selection in vivo, which together clarify the importance of the nucleosomal structure of the integration acceptor DNA. Recently, Segal et al. (2006) reported methods for mapping the primary sequences that dictate the placement of genomic DNA on nucleosomes, allowing us to map the positions of nucleosomes in integration target DNA. Using this method, we found a periodic pattern of integration relative to the predicted underlying nucleosomes, indicating favored integration on outward-facing major grooves on nucleosome-wrapped DNA in the biologically relevant chromosomal environment. We then analyzed the pattern of integration sites relative to extensive annotation available for the Encyclopedia of DNA element (ENCODE) regions (The ENCODE Project Consortium 2004). These regions comprise only 1% of the human genome but are very deeply annotated. Thanks to the very large number of integration sites in our study, we were able to carry out statistical tests for correlations with ENCODE annotation. We found that integration was strongly associated with a collection of histone post-translational modifications linked to active transcription (H3 acetylation, H4 acetylation, and H3 K4 methylation) and negatively associated with inhibitory modifications (H3 K27 trimethylation and DNA CpG methylation).
Results
Sequence determination of 40,569 unique sites of HIV integration on the human genome
To isolate DNA samples for pyrosequencing, Jurkat T cells were incubated with an HIV-based vector, then DNA fragments from host-virus junctions were prepared using ligation-mediated PCR (Schroder et al. 2002; Wu et al. 2003; Mitchell et al. 2004; Ciuffi et al. 2005). Two restriction enzyme cocktails were used to cleave the human genome: One used MseI, which recognizes a four-base site, and the other used a pool of enzymes that recognize six-base sequences (AvrII, SpeI, and NheI). The digested cellular DNA was ligated to linkers, and the junction between the viral and cellular DNA was amplified. In the analysis presented below, integration site data sets isolated after cleavage with each of the two restriction enzymes (named HIV-Mse and HIV-Avr) are often presented separately to provide an indication of reproducibility. Using pyrosequencing (Margulies et al. 2005), we obtained 165,572 raw sequence reads, which after quality control and dereplication yielded 40,569 unique sites on the human genome (Fig. 1; for details, see Supplemental Table S1).
HIV DNA integration sites and genomic annotation mapped on the human genome. The human chromosomes are shown numbered. Unsequenced regions are shown in gray. The uppermost track on each chromosome indicates the locations of (1) ENCODE regions and (2) loci showing either greater or less HIV integration than predicted by the multiple regression model. ENCODE regions hosting more integration events than predicted (using a false discovery rate of 5%) are shown in red, those showing less are colored blue, and those ENCODE regions that contain sites not significantly different from that predicted by the model are colored black. Genome-wide loci showing greater integration than predicted are shown in red (hot) or orange (warm), indicating regions with 10 (red) or 50 (orange) sites where fewer were expected. Gray (cool) indicates regions with at least 10 integration events, where more were expected. Proceeding downward, integration site densities for the HIV-Mse (green; densities color-coded ranging from zero to 103 sites per 500-kb genomic segments) or HIV-Avr (red; ranging from one to 122 sites per 500-kb window) are shown in the next two (wider) tracks. In the next track down, the blue gradient indicates the number of Refseq transcription start sites, ranging from zero to 66 sites, located in a given 500-kb window. The next track (purple) shows Refseq gene coverage density, which quantifies the fraction of a given 500-kb window (0%–100%) that contains Refseq transcription units. The bottom track (brown) shows the G/C content (33%–61%) averaged over 500-kb intervals.

As controls, two sets of 60,000 matched random control sites were generated (termed MRC-Mse and MRC-Avr). In the matching procedure, each integration site was matched with control sites that were randomly placed in the genome but constrained to lie the same distance from a restriction enzyme recognition site used to isolate the experimental site. Comparison of experimental sites to the matched random controls thus “washed out” any possible biases introduced by the use of restriction enzyme cleavage.
Below we first describe sequence features at the point of integration and then consider associations of HIV integration with annotation genome-wide.
Modeling nucleosome positioning predicts favored integration on outward facing DNA major grooves
The discovery of DNA sequences guiding nucleosome positioning allowed us to investigate the relationship between HIV integration sites and nucleosomes bound to target DNA. Segal et al. (2006) found that DNA sequence effects explain ∼50% of the positioning of nucleosomes on chromosomal DNA, and devised a computational method that allows prediction of high-occupancy nucleosome positions. We used their method to predict nucleosomes in the 5 kb surrounding each HIV integration site. About 80% of both the experimental integration sites and the random control sites were predicted to lie on nucleosome-bound DNA, as expected since chromosomal DNA is predicted to be ∼75%–90% nucleosome-associated (Segal et al. 2006).
When the HIV integration sites were plotted relative to the predicted nucleosomal axis of twofold symmetry, a distinctive pattern was seen (Fig. 2). A strongly periodic pattern was observed for both the HIV-Avr and HIV-Mse data sets (Fig. 2A,B). Alignment of the periodic integration pattern relative to the nucleosome center of symmetry (Richmond and Davey 2003) revealed that integration is favored at phosphate backbone sites at the edges of outwardly facing major grooves. A Fourier transformation analysis of the periodicity showed peaks at 10.7 bp for both HIV data sets (Fig. 2C,D). In contrast, no significant periodicity was seen in the matched random controls. Statistical analysis showed that the difference achieved P < 10−7 for each data set (Pearson χ2 test, comparing each base position for integration sites versus matched random controls). These data are as expected for favored integration by HIV on outwardly facing major groove sites in nucleosomal DNA, allowing the inference that nucleosome-wrapped chromosomal DNA is indeed the in vivo integration target.
HIV favors integration in the major grooves of DNA on nucleosomes. Positions of HIV integration sites on nucleosomes were predicted based on the chicken nucleosome prediction model developed by Segal et al. (2006). The percentage of integration events occurring on nucleosomes is shown for each DNA position relative to the symmetric dyad axis (position 0): (A) 19,962 HIV-Avr sites (gray) and 59,763 matched random control sites for Avr (black line); (B) 20,607 HIV-Mse sites (gray) and 61,692 matched random control sites for Mse (black line). (C, D) Fourier transformation of the data from A and B, respectively, showing periodicity for both HIV-Avr and HIV-Mse.

Favored target DNA sequences for HIV integration
Figure 3, A and B summarize the local DNA sequences at integration sites from the HIV-Avr and HIV-Mse data sets. A weakly conserved inverted repeat sequence from base position −3 to 7 was observed, matching that reported previously (Stevens and Griffith 1996; Carteau et al. 1998; Holman and Coffin 2005; Wu et al. 2005; Berry et al. 2006). The placement of the inverted repeat is as expected for symmetric integration at the two ends of the viral DNA. The measured information content for each base in the consensus region is essentially identical between the two data sets. No such preferred sequences were seen for the matched random controls (data not shown).
Favored DNA sequences for HIV integration, analyzed using WebLogo. The point of HIV integration in the target DNA sequence occurs between positions 0 and −1 (for the sequenced HIV DNA ends). For the complementary strand, the point of integration occurs between positions 4 and 5. Y-axis represents the information content at each target base position (perfect conservation would have a score of 2 bits). The height of the letter reflects the degree of base conservation. (A) Analysis 10,000 HIV-Avr sites. (B) Analysis of 10,000 HIV-Mse sites. (C) Forty-one integration sites that host two independent integration events, compared with 10,000 HIV-Avr sites (D). Essentially identical results were obtained for comparison to HIV-Mse sites (data not shown). Note the difference in scale of the Y-axis.
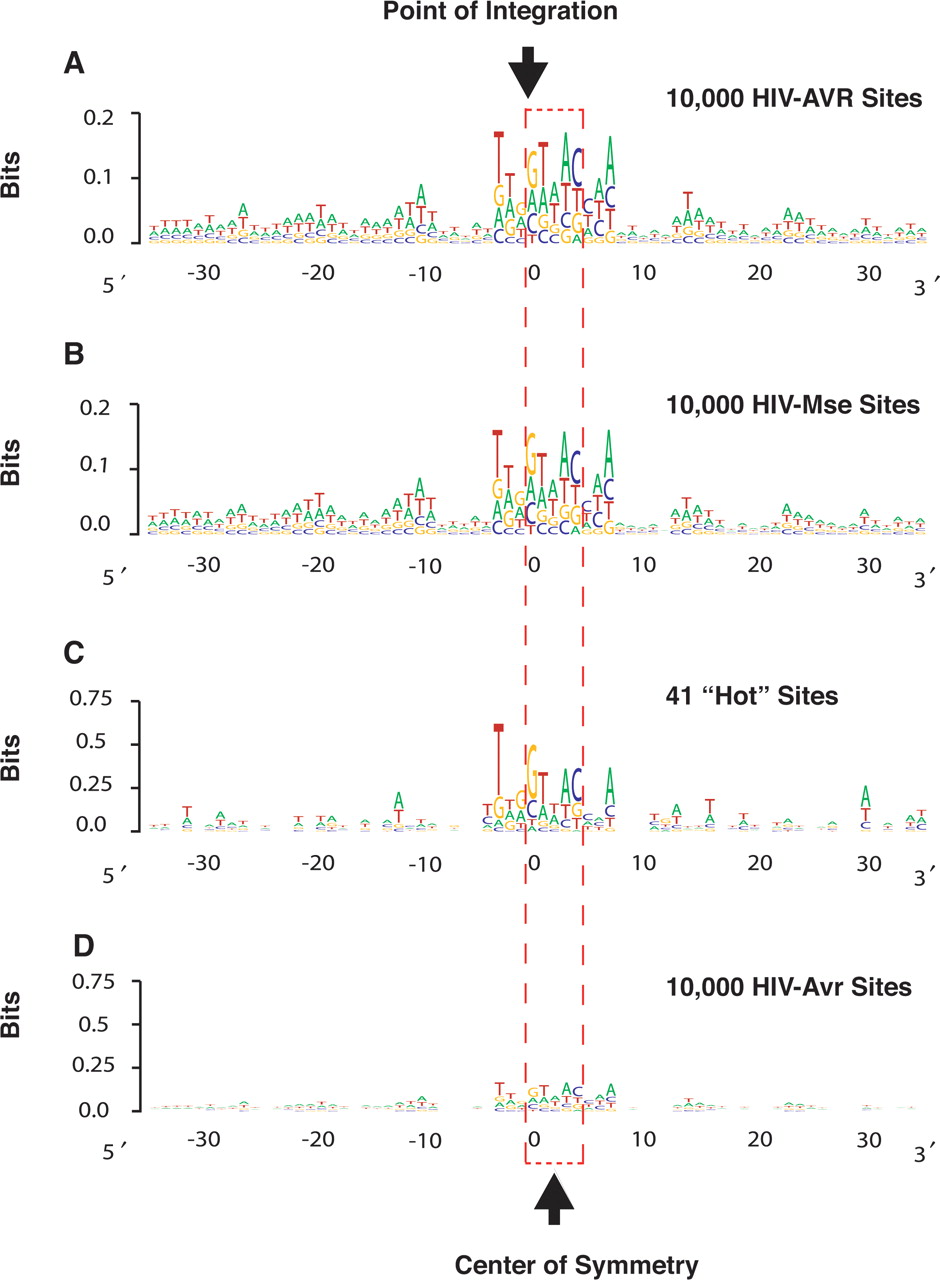
Analysis of the large number of sites from the HIV-Avr and HIV-Mse data sets revealed that the inverted repeat is flanked by periodic A/T-rich sequences extending out over a 50-bp region. A/T-rich sequences are known to facilitate bending of DNA on nucleosomes (Satchwell et al. 1986) and are often associated with the major groove facing outward from the histone core (Segal et al. 2006). Thus these periodic A/T-rich sequences may serve to orient the target DNA on the nucleosome, thereby positioning the favored central palindromic sequences in the major groove for HIV integration. Another possibility is that the A/T-rich sequences facilitate binding of the integration cofactor PSIP1/LEDGF/p75 (discussed further below).
Primary sequences at genomic locations hosting multiple integration events
We found 41 sites that hosted two independent integration events at exactly the same base pair in the human genome. Sites were only included in the analysis if the proviruses integrated at a single site were in opposite orientations, indicating independent events. Alignment of the primary sequences surrounding these highly favored sites shows much closer matches to the consensus palindrome than in the HIV-Avr and HIV-Mse data sets as a whole (Fig. 3C,D; note different scales). Analysis of these sites in the context of a comprehensive statistical model for integration intensity (Berry et al. 2006; and below) showed that highly favored integration at these sites was explained both by the favorable local DNA sequence and a globally favorable chromosomal environment.
Genome-wide chromosomal features associated with HIV integration
We first carried out several measures of reproducibility in integration site data sets. We compared the HIV-Avr and HIV-Mse data sets to each other and found no substantial differences, documenting that the restriction enzymes chosen for the linker ligation step did not affect the conclusions (Supplemental Data S1). The HIV-Avr and HIV-Mse data sets were then compared with previously determined integration site data sets (Supplemental Data S2). Particularly close parallels were seen between the HIV-Avr and HIV-Mse data and published data from HIV integration sites in cultured human T cells. Integration in the HIV-Avr and HIV-Mse data sets was favored in transcription units across all gene catalogues analyzed (P < 0.0001), in relatively more active genes (P < 0.0001), and in Alu elements (P < 0.0001), which accumulate in gene-rich regions. Integration was disfavored in CpG islands (P < 0.0001) and in repeated sequences enriched in gene-sparse regions (human endogenous retroviruses [HERVs], and LINE elements; both P < 0.0001). Integration was also disfavored in α-satellites, most of which are found in centromeres.
The large number of sites available allowed the first analysis of integration in pericentromeric and subtelomeric regions. We defined pericentromeric regions as the most proximal 1 Mb sequence from the centromere, and subtelomeric regions as the most proximal 500 kb from chromosome ends. For both the HIV-Avr and HIV-Mse data sets, integration was strongly disfavored in the pericentromeric regions (0.9% vs. 1.5% in random control; P < 0.0001), possibly reflecting extension of centromeric heterochromatin into these regions. In contrast, the subtelomeric regions were favorable for HIV integration (2.7% vs. 0.7% in random control; P < 0.0001). These regions are relatively highly transcribed (Riethman et al. 2004), potentially explaining preferred integration.
Biased integration in specific classes of human genes
The ontology of genes hosting HIV integration events was analyzed using EASE 2.0 (Hosack et al. 2003) to identify favored and disfavored functional groups. Because many ontology classes were queried, a Bonferroni correction was applied to control for erroneous inflation of positive calls due to multiple comparisons. Both the HIV-Mse and HIV-Avr data sets showed preferential integration in a collection of genes involved in metabolism, mitosis, cell cycle, and RNA metabolism (Supplemental Table S2). One possible explanation for these findings would be that they were the result of selection for integration in certain gene subsets during cell growth after integration, but several previous studies indicate that such effects are minor over the time scales studied here (Lewinski et al. 2005, 2006; Berry et al. 2006). These findings support the idea that a broad group of “housekeeping” genes are favored HIV integration targets.
A transcriptional regulatory protein, PSIP1/LEDGF/p75, was previously implicated in HIV integration targeting (Ciuffi et al. 2005), raising the question of whether an influence of PSIP1/LEDGF/p75 could be detected here. We performed transcriptional profiling analysis on RNAs from wild-type Jurkat cells and Jurkat cells knocked down for PSIP1/LEDGF/p75 (Jurkat-siJK2) (Llano et al. 2004b; Ciuffi et al. 2005). PSIP1/LEDGF/p75-responsive genes were identified using the Significance Analysis of Microarray package and a false discovery rate of 5%. We found that 731 transcription units were up-regulated, and 835 were down-regulated. Statistical analysis showed that these PSIP1/LEDGF/p75-regulated genes were favored targets for integration, paralleling a previous analysis in human embryonic kidney cells (Ciuffi et al. 2005). We analyzed these PSIP1/LEDGF/p75-responsive genes according to their gene ontology (with Bonferroni correction) and found that the PSIP1/LEDGF/p75–up-regulated genes are overrepresented in immune and defense responses, as well as response to biotic stimulus, whereas the PSIP1/LEDGF/p75–down-regulated genes are overrepresented in the macromolecule biosynthesis, ubiquitin, and modification-dependent protein catabolism categories. The finding that genes regulated by PSIP1/LEDGF/p75 are often involved in macromolecule biosynthesis and protein catabolism provides a potential mechanistic explanation for some of the favoring of HIV integration in “housekeeping” genes.
We also analyzed HIV integration frequency in genes transcribed by Pol III. The number of sites in Pol III–transcribed genes was low (only nine), but comparison to the matched random control (which contained only one) suggested that Pol III–transcribed genes may be favorable for integration (P < 0.0001). Pol I–transcribed genes could not be evaluated because they have not been fully sequenced.
Genome-wide mapping of unexpectedly favorable or disfavorable regions for HIV integration
One of the initial goals of this study was to identify possible new influences on HIV integration frequency not accessible in previous smaller-scale studies. One approach to this takes advantage of previously developed quantitative models for predicting integration intensity (Supplemental Data S3; Berry et al. 2006). Briefly, these models quantified how well annotation of individual genomic features (e.g., gene density, CpG island, gene 5′ end, etc.) can be used to distinguish authentic integration sites from random controls. Genomic features showing predictive values could then be combined into a single comprehensive model using multiple conditional-logit regression and other methods, which takes into account redundancy (“confounding effects”) among correlated types of genomic annotation. Using such a model, any base in the human genome could be scored for its relative likelihood of hosting an HIV integration event.
Such models were generated for the HIV-Avr and HIV-Mse data sets (Berry et al. 2006). We found that integration was favored in A/T-rich target DNA sequences that are flanked by regions of high G/C content—over intervals of 50 bases to 100 kb, A/T-rich DNA is favored, while over intervals from 250 kb to 5 Mb, G/C-rich DNA is favored. This sequence composition effect was a strong predictor of HIV integration frequency, independent of previously known features (Supplemental Data S3), and so was added to the multiple-regression model. We conjecture that the local A/T-rich sequences may promote favorable nucleosome positioning, or promote binding of PSIP1/LEDGF/p75, which contains an A/T-hook DNA binding motif. The more distant favoring of G/C is consistent with the known favoring of integration in gene-rich regions, which are also G/C-rich.
Multiple-regression models derived from the HIV-Avr and HIV-Mse data sets were used to predict integration intensity, and then predictions were compared to the experimentally observed intensity. The model generally performed well at estimating integration intensity for many locations, but nine regions with unexpectedly high integration intensity and five with unexpectedly low intensity were detected (5% false discovery rate) (Efron 2004). These regions are mapped on each chromosome in Figure 1, and data for each chromosome are shown in Supplemental Data S4. Because the computational approach used required the presence of many integration sites in an interval to allow evaluation, only large intervals could be scored—thus the number of anomalous intervals should be regarded as a lower limit. However, the results are sufficient to establish that genomic features known to correlate with HIV integration from previous work cannot fully explain the distribution seen in the HIV-Mse and HIV-Avr data sets.
Predicted and observed integration frequency in the ENCODE regions
In an effort to define additional genomic features directing integration, we analyzed target site selection in the ENCODE regions. There are 44 ENCODE regions, together comprising ∼1% of the human genome. Some regions are well-known loci such as the alpha-globin, beta-globin, and HOXA gene clusters, while others were selected at random. More than 220 tracks of unique annotation of genomic features are available in the ENCODE regions. Of particular note, chromatin immmunoprecipitation–microarray analysis (ChIP-chip assay) has been carried out for many DNA binding proteins in diverse cell types in the ENCODE regions. DNA methylation, transcriptional activity, and functional promoters have also been mapped. For the HIV-Avr and HIV-Mse site data sets, 866 integration sites were available in the ENCODE regions, allowing statistical tests of association with ENCODE annotation. The number of integration sites per ENCODE region ranged from 0 to 188. As a control, we generated and analyzed more than 8000 matched random controls within the ENCODE regions (designated as MRC-E-Avr and MRC-E-Mse).
We first asked whether any of the ENCODE regions showed significant divergence from the integration frequency predicted by the multiple regression model. For this analysis, it was feasible to score every base in the ENCODE regions for its likelihood of hosting an integration event. Examples of predicted and observed cumulative integration are shown in Figure 4,A and B (all regions are in Supplemental Data S6). Five of the 44 ENCODE regions contained significantly more integration sites than predicted by the model; seven regions, unexpectedly few. For example, ENCODE region ENr332 (Fig. 4A) contained 60 sites, while only 21 were expected. Most of the surplus sites clustered in a single gene, SF1, which encodes splicing factor 1. The pattern of integration in this region was quite similar for both the HIV-Avr and HIV-Mse data sets. For ENm009 (Fig. 4B), which is the beta-globin region, only one integration site was detected, although 11 were expected. This region is quite gene dense, although the beta-globin genes and flanking genes encoding olfactory receptors are not highly expressed in the Jurkat T-cell line studied here. Thus some of the ENCODE regions contain significant divergences from the multiple regression model, allowing the mechanistic basis to be investigated by analysis of ENCODE annotation.
Integration sites in the ENCODE regions, emphasizing regions that diverge from the multiple regression model. (A) An unexpectedly favorable ENCODE region—ENr332. (B) An unexpectedly disfavorable ENCODE region—ENm009 (beta-globin region). (Top panel) The observed (black line) cumulative histogram of HIV integration events is plotted against the prediction (green line) based on the fitted model as described in Supplemental Data S4. The bottom panel shows the corresponding ENCODE region captured from the UCSC genome browser. The top five tracks are custom annotations: (from top to bottom) the ENCODE-wide matched random controls for the two Mse and Avr integration data sets (MRC-E-Mse and MRC-E-Avr), the experimental HIV-Mse and HIV-Avr integration sites, and transcriptional profiling data from Jurkat cells (shades of gray; highly expressed genes are dark). The genome-wide annotations are shown (from top to bottom): G/C percentage, RefSeq genes, CpG islands, and DNase I hypersensitivity sites. Below are selected ENCODE annotations (from top to bottom): ENCODE tracks showing intensities of various histone post-translational modification in lymphoid cells (GM06990) and DNA CpG methylation. The P-values and observed versus expected numbers of sites are shown on the figure panels.

HIV integration frequency is associated with epigenetic modifications
We quantified the possible association of more than 220 ENCODE annotation tracks with HIV integration frequency. This revealed that 145 tracks showed significant association with at least one of the HIV-Avr or HIV-Mse data sets. To control for increased false-positive calls due to multiple comparisons, we applied the Bonferroni correction to the P-values and further required significance independently in both the HIV-Avr and HIV-Mse data sets. This left 52 significantly associated ENCODE tracks (Supplemental Table S3). Strong positive associations were seen with markers of transcriptionally active chromatin, including H3 K4 mono-, di-, and tri-methylation, H3 K9/K14 acetylation, and H4 acetylation (Fig. 5A–C; data not shown). Integration was negatively associated with H3 K27 tri-methylation (Fig. 5D), a histone mark known to be associated with heterochromatin. DNA CpG methylation was also negatively associated with integration (Fig. 5E). Also positively correlated with HIV integration were steady-state RNA levels measured by tiling arrays, bound RNA Pol II (POLR2A), and bound SP3 (Supplemental Table S3; Supplemental Data S7).
The effect of epigenetic modifications on HIV integration frequency in the ENCODE region. HIV integration sites and their matched random control sites were annotated using the indicated ENCODE tracks and then distributed into 10 bins based on the ENCODE annotation values. The expectation for random distribution is indicated by the horizontal line at one. For each annotation in A–D, both HIV-Avr (dark gray) and HIV-Mse (light gray) data sets achieved P < 10−6 for comparison to random distribution. ENCODE annotation: (A) H3 acetylation, (B) H3 K4 mono-methylation, (C) H4 acetylation, (D) H3 K27 tri-methylation, and (E) DNA CpG methylation (P < 0.0002).

Figure 4,A and B shows annotation tracks for histone post-translational modification and CpG methylation in ENCODE regions ENr332 and ENm009. For ENr332, areas where more integration sites were observed than expected from our model are especially rich in histone post-translational modifications associated with active chromatin. Overall, this region is depleted for CpG methylation. For the beta-globin locus (ENm009), the entire region is highly CpG methylated and is particularly rich in H3 K27 tri-methylation, which is associated with heterochromatin. The beta-globin gene cluster is associated with active marks in erythroid cells but not other cell types. For comparison, the alpha-globin ENCODE region (ENm008) hosted fully 188 integration sites. Although the alpha-globin locus is not expressed in T cells, other genes in the locus are. The alpha-globin region is rich in histone marks associated with active chromatin and is low for CpG methylation, in lymphoid cells.
Did the data on histone post-translational modifications add anything to our understanding of HIV integration beyond previously identified features? To investigate this, we asked whether addition of the epigenetic modification data to the full model in (Berry et al. 2006) could improve prediction of HIV integration sites. Significant improvement was indeed detected for addition of data on histone modification, particularly H3 K9/K14 acetylation and H4 acetylation, although these variables were partially redundant with measures of gene density and chromatin structure (see Supplemental Data S5, p. 3 for P-values). Thus the contribution of epigenetic modification to HIV integration targeting is partially independent of previously known features.
We also used the statistical model to investigate whether information on targeting by PSIP1/LEDGF/p75 (Ciuffi et al. 2005, 2006a; Kang et al. 2006) might be redundant with other forms of genomic annotation such as epigenetic modifications. Analysis of data on PSIP1/LEDGF/p75-responsive genes in combination with other types of genomic annotation did not reveal redundant effects on integration targeting (see Supplemental Data S5). Similarly, no correlation could be detected between PSIP1/LEDGF/p75-responsive genes and other forms of genomic annotation (Pearson correlation coefficients all <0.108) (for a full list of the variables studied, see Table S4). Thus data so far indicate that PSIP1/LEDGF/p75 influences integration targeting independently of the other genomic features studied.
Discussion
The findings reported here were made possible by several technical advances. Use of pyrosequencing (Margulies et al. 2005) allowed us to determine 40,569 unique HIV integration site sequences, which provided a much larger data set than any available previously. Also crucial was the extensive annotation generated by the ENCODE project (The ENCODE Project Consortium 2004), which allowed the correlations between HIV integration and epigenetic modifications to be quantified. Two bioinformatic advances were also essential. The first was the development of improved methods for predicting the placement of nucleosomes in chromosomal DNA (Segal et al. 2006), which allowed the demonstration of favored integration in outward-facing major grooves on nucleosomes. The second was the development of statistical techniques for annotating each base in the human genome for its likelihood of hosting integration events (Berry et al. 2006), allowing the contribution of new genomic features to be assessed. Using this method, epigenetic modifications could be shown to influence integration partially independent of known genomic features.
Do histone post-translational modifications directly affect integration site selection? A family of related integrase enzymes encoded by yeast retrotransposons contain chromodomains (Hizi and Levin 2006a), which bind methylated histone tails, thus direct binding is a candidate explanation for integration targeting. However, retroviral integrases do not contain domains known to bind modified histones. Another possibility is that the cellular proteins recruited by specific histone post-translational modifications tether integration complexes near sites of modification. HIV-1 integrase has been reported to bind to several chromatin-associated proteins (Kalpana et al. 1994; Peytavi et al. 1999), providing candidate ligands. Alternatively, epigenetic modifications may be only markers of favored integration sites and not directly involved in the targeting mechanism.
For PSIP1/LEDGF/p75, the one ligand for HIV integrase experimentally demonstrated to be functionally important for targeting (Ciuffi et al. 2005, 2006a; Kang et al. 2006), evidence presented here suggests it is not acting through a mechanism that is linked with histone modifications or other known genomic feature. Effects of PSIP1/LEDGF/p75 on HIV targeting were independent of the other types of genomic annotation studied, including gene density, histone modification, base composition, and others (Supplemental Materials S3, S5). Similarly, a direct analysis of the relationship between PSIP1/LEDGF/p75-responsive genes and other forms of genomic annotation showed little correlation (Supplemental Table S4), indicating that effects of PSIP1/LEDGF/p75 (as reported by PSIP1/LEDGF/p75 responsiveness) are independent of other known genomic features.
The collection of methods described here should be useful in a variety of further studies. It is possible to modulate epigenetic modifications in cells, and the pyrosequencing and statistical approaches described here can be used to evaluate the functional roles of the different modifications. Different retroviruses and transposons show different favored integration targets, and it will be of interest to apply the pyrosequencing and bioinformatic methods to analyze their target site preferences. More long term, as the influence of epigenetic modification on retroviral integration comes to be well understood, it may become possible to use retroviral integration as a probe for mapping epigenetic modification patterns in cells. Lastly, the pyrosequencing and bioinformatic methods described here should be useful for characterizing integration sites generated during human gene therapy with integrating vectors to help monitor possible genotoxicity.
Methods
Mapping of HIV integration sites on the human genome
The viral vector stock was prepared by transfection of p156RRLsin-PPTCMVGFPWPRE (Follenzi et al. 2000), the packaging construct pCMVdeltaR9 (Naldini et al. 1996), and the vesicular stomatitis virus G-producing plasmid pMD.G into 293T cells. Viral supernatant was harvested 38 h after transfection, filtered through 0.45-μm filters, concentrated, treated with DNase I, and stored frozen at −80°C. Jurkat cells at a density of 1 × 10⁶ cells were inoculated with 200–400 ng/p24 capsid antigen for 24 h in the presence of 10 μg/mL DEAE-dextran, washed, and cultured for an additional 48 h in 2 mL of RPMI containing 10% heat-inactivated FCS and 50 μg/mL gentamicin. Fifty independent infections of Jurkat cells were performed. Cells were harvested at 72 h. At least 80% of cells expressed GFP as analyzed by FACS. Genomic DNA was extracted using the DNeasy tissue kit (Qiagen). Two restriction enzyme digestions (with AvrII, SpeI, and NheI or MseI) were performed on DNA from each infected culture. The digested DNA samples were ligated to linkers and then amplified by nested PCR. The PCR products were gel-purified, pooled, and sent to 454 Life Sciences for pyrosequencing. Integration sites were judged to be authentic if the sequences began within 3 bp of HIV LTR ends, had a >98% sequence match, and had a unique best hit when aligned to the draft human genome (hg17) using BLAT. All integration site sequences have been deposited into GenBank under accession nos. EI522403-EI666579.
Bioinformatic analysis
Detailed bioinformatic methods can be found in Berry et al. (2006) and Supplemental Data S3 through S6. Q values were computed using the method of Dabney and Storey (see the R1.1 Supporting materials at http://cran.r-project.org/doc/packages/qvalue.pdf). For the analysis of integration in subtelomeric and pericentromeric regions, sequences aligned to multiple chromosomal locations (i.e., multiple hits) within these regions were included in our analysis, and gaps were excluded in determining the sequence segments analyzed.
The placement of nucleosomes on chromosomal regions hosting integration events was mapped using the nucleosomes positioning prediction tool available at http://genie.weizmann.ac.il/pubs/nucleosomes06/index.html (Segal et al. 2006), using 5 kb of human sequence surrounding each integration site for analysis. Positions of integration sites on nucleosomes were smoothed using a 3-bp moving window. Fourier transformation analysis of the nucleosome data was performed using Statistica (StatSoft). Primary target DNA sequences were aligned using WebLogo (http://weblogo.Berkeley.edu/logo.cgi). Ontology of genes hosting integration sites, and genes modulated by PSIP1/LEDGF/p75, was analyzed using EASE 2.0 (Hosack et al. 2003).
Transcriptional profiling
RNA was isolated from wild-type and Jurkat-siJK2 cells (Llano et al. 2004b) using three independent cultures for each cell type. Transcriptional profiling was performed using Affymetrix microarrays (HU133 plus 2.0). Genes significantly changed between the two cell types were extracted using the Significance Analysis of Microarray package, taking a 5% false discovery rate. Raw data for transcriptional profiling have been deposited in NCBI Gene Expression Omnibus under accession no. GSE7508.
A Web-based resource for interactive analysis of HIV integration sites
The HIV-Avr and HIV-Mse integration sites, and transcriptional profiling data, are hosted at http://microb230.med.upenn.edu/ucsc/, along with instructions for mounting the data as custom tracks on the UCSC genome browser.
Acknowledgments
We thank members of the ENCODE Consortium, especially Dr. Richard Myers and coworkers at Stanford University, and Dr. Ian Dunham and coworkers at the Sanger Institute, who contributed the ENCODE data that are pivotal to our analysis. We thank members of the Bushman laboratory for materials and helpful discussions. This work was supported by NIH grants AI52845, and AI66290, the James B. Pendleton Charitable Trust, and Robin and Frederic Withington. A.C. was supported in part by a fellowship from the Swiss National Science Foundation. G.P.W. was supported by NIH NIAID T32 AI07634 (Training Grant in Infectious Diseases).
References
- ↵S.D. Barr,J. Leipzig,P. Shinn,J.R. Ecker,F.D. Bushman,(2005) Integration targeting by avian sarcoma-leukosis virus and human immunodeficiency virus in the chicken genome. J. Virol. 79:12035–12044.
- ↵S.D. Barr,A. Ciuffi,J. Leipzig,P. Shinn,J.R. Ecker,F.D. Bushman,(2006) HIV integration site selection: Targeting in macrophages and the effects of different routes of viral entry. Mol. Ther. 14:218–225.
- ↵C. Berry,S. Hannenhalli,J. Leipzig,F.D. Bushman,(2006) Selection of target sites for mobile DNA integration in the human genome. PLoS Comput. Biol. 10.1371/journal.pcbi.0020157.
- ↵D. Bisgrove,M. Lewinski,F.D. Bushman,E. Verdin,(2005) Molecular mechanisms of HIV-1 proviral latency. Expert Rev. Anti Infect. Ther. 3:805–814.
- ↵F.D. Bushman,(2001) Lateral DNA transfer: Mechanisms and consequences (Cold Spring Harbor Laboratory Press, Cold Spring Harbor, NY).
- ↵F. Bushman,M. Lewinski,A. Ciuffi,S. Barr,J. Leipzig,S. Hannenhalli,C. Hoffman,(2005) Genome-wide analysis of retroviral DNA integration. Nat. Rev. Microbiol. 3:848–858.
- ↵S. Carteau,C. Hoffmann,F.D. Bushman,(1998) Chromosome structure and HIV-1 cDNA integration: Centromeric alphoid repeats are a disfavored target. J. Virol. 72:4005–4014.
- ↵P. Cherepanov,G. Maertens,P. Proost,B. Devreese,J. Van Beeumen,Y. Engelborghs,E. De Clercq,Z. Debyser,(2003) HIV-1 integrase forms stable tetramers and associates with LEDGF/p75 protein in human cells. J. Biol. Chem. 278:372–381.
- ↵A. Ciuffi,M. Llano,E. Poeschla,C. Hoffmann,J. Leipzig,P. Shinn,J.R. Ecker,F.D. Bushman,(2005) A role for LEDGF/p75 in targeting HIV DNA integration. Nat. Med. 11:1287–1289.
- ↵A. Ciuffi,T.L. Diamond,Y. Hwang,H.M. Marshall,F.D. Bushman,(2006a) Modulating target site selection during human immunodeficiency virus DNA integration in vitro with an engineered tethering factor. Hum. Gene Ther. 17:960–967.
- ↵A. Ciuffi,R.S. Mitchell,C. Hoffman,J. Leipzig,P. Shinn,J.R. Ecker,F.D. Bushman,(2006b) Integration site selection by HIV-based vectors: Targeting in dividing and nondividing IMR-90 lung fibroblasts. Mol. Ther. 13:366–373.
- ↵J.M. Coffin,S.H. Hughes,H.E. Varmus,(1997) Retroviruses (Cold Spring Harbor Laboratory Press, Cold Spring Harbor).
- ↵B. Efron,(2004) Large scale simultaneous hypothesis testing: The choice of a null hypothesis. J. Am. Stat. Assoc. 99:96–104.
- ↵The ENCODE Project Consortium (2004) The ENCODE (ENCyclopedia Of DNA Elements) Project. Science 306:636–640.
- ↵A. Follenzi,L.E. Ailes,S. Bakovic,M. Gueuna,L. Naldini,(2000) Gene transfer by lentiviral vectors is limited by nuclear translocation and rescued by HIV-1 pol sequences. Nat. Genet. 25:217–222.
- ↵S. Hacein-Bey-Abina,C. von Kalle,M. Schmidt,F. Le Deist,N. Wulffraat,E. MacIntyre,I. Radford,J.L. Villeval,C.C. Fraser,M. Cavazzana-Calvo,(2003a) A serious adverse event after successful gene therapy for X-linked severe combined immunodeficiency. N. Engl. J. Med. 348:255–256.
- ↵S. Hacein-Bey-Abina,C. Von Kalle,M. Schmidt,M.P. McCormack,N. Wulffraat,P. Leboulch,A. Lim,C.S. Osborne,R. Pawliuk,E. Morillon,(2003b) LMO2-associated clonal T cell proliferation in two patients after gene therapy for SCID-X1. Science 302:415–419.
- ↵A. Hizi,H.L. Levin,(2005) The integrase of the long terminal repeat-retrotransposon tf1 has a chromodomain that modulates integrase activities. J. Biol. Chem. 280:39086–39094.
- ↵A.G. Holman,J.M. Coffin,(2005) Symmetrical base preferences surrounding HIV-1, avian sarcoma/leukosis virus, and murine leukemia virus integration sites. Proc. Natl. Acad. Sci. 102:6103–6107.
- ↵D.A. Hosack,G. Dennis, Jr.B.T. Sherman,H.C. Lane,R.A. Lempicki,(2003) Identifying biological themes within lists of genes with EASE. Genome Biol. 10.1186/gb-2003-4-10-r70.
- ↵A. Jordan,D. Bisgrove,E. Verdin,(2003) HIV reproducibly establishes a latent infection after acute infection of T cells in vitro. EMBO J. 22:1868–1877.
- ↵G.V. Kalpana,S. Marmon,W. Wang,G.R. Crabtree,S.P. Goff,(1994) Binding and stimulation of HIV-1 integrase by a human homolog of yeast transcription factor SNF5. Science 266:2002–2006.
- ↵Y. Kang,C.J. Moressi,T.E. Scheetz,L. Xie,D.T. Tran,T.L. Casavant,P. Ak,C.J. Behnam,B.L. Davidson,P.B. McCray,(2006) Integration site choice of a feline immunodeficiency virus vector. J. Virol. 80:8820–8823.
- ↵M. Lewinski,D. Bisgrove,P. Shinn,H. Chen,E. Verdin,C.C. Berry,J.R. Ecker,F.D. Bushman,(2005) Genome-wide analysis of chromosomal features repressing HIV transcription. J. Virol. 79:6610–6619.
- ↵M.K. Lewinski,M. Yamashita,M. Emerman,A. Ciuffi,H. Marshall,G. Crawford,F. Collins,P. Shinn,J. Leipzig,S. Hannenhalli,(2006) Retroviral DNA integration: Viral and cellular determinants of target-site selection. PLoS Pathog. 10.1371/journal.ppat.0020060.
- ↵M. Llano,S. Delgado,M. Vanegas,E.M. Poeschla,(2004a) LEDGF/p75 prevents proteasomal degradation of HIV-1 integrase. J. Biol. Chem. 279:55570–55577.
- ↵M. Llano,M. Vanegas,O. Fregoso,D. Saenz,S. Chung,M. Peretz,E.M. Poeschla,(2004b) LEDGF/p75 determines cellular trafficking of diverse lentiviral but not murine oncoretroviral integrase proteins and is a component of functional lentiviral preintegration complexes. J. Virol. 78:9524–9537.
- ↵M. Llano,D.T. Saenz,A. Meehan,P. Wongthida,M. Peretz,W.H. Walker,W. Teo,E.M. Poeschla,(2006) An essential role for LEDGF/p75 in HIV integration. Science 314:461–464.
- ↵G. Maertens,P. Cherepanov,W. Pluymers,K. Busschots,E. De Clercq,Z. Debyser,Y. Engelborghs,(2003) LEDGF/p75 is essential for nuclear and chromosomal targeting of HIV-1 integrase in human cells. J. Biol. Chem. 278:33528–33539.
- ↵M. Margulies,M. Egholm,W.E. Altman,S. Attiya,J.S. Bader,L.A. Bemben,J. Berka,M.S. Braverman,Y.J. Chen,Z. Chen,(2005) Genome sequencing in microfabricated high-density picolitre reactors. Nature 437:376–380.
- ↵R.S. Mitchell,B.F. Beitzel,A.R. Schroder,P. Shinn,H. Chen,C.C. Berry,J.R. Ecker,F.D. Bushman,(2004) Retroviral DNA integration: ASLV, HIV, and MLV show distinct target site preferences. PLoS Biol. 2:E234.
- ↵L. Naldini,U. Blomer,P. Gallay,D. Ory,R. Mulligan,F.H. Gage,I.M. Verma,D. Trono,(1996) In vivo gene delivery and stable transduction of nondividing cells by a lentiviral vector. Science 272:263–267.
- ↵R. Peytavi,S.S. Hong,B. Gay,A.D. d'Angeac,L. Selig,S. Benichou,R. Benarous,P. Boulanger,(1999) HEED, the product of the human homolog of the murine eed gene, binds to the matrix protein of HIV-1. J. Biol. Chem. 274:1635–1645.
- ↵D. Pruss,F.D. Bushman,A.P. Wolffe,(1994a) Human immunodeficiency virus integrase directs integration to sites of severe DNA distortion within the nucleosome core. Proc. Natl. Acad. Sci. 91:5913–5917.
- ↵D. Pruss,R. Reeves,F.D. Bushman,A.P. Wolffe,(1994b) The influence of DNA and nucleosome structure on integration events directed by HIV integrase. J. Biol. Chem. 269:25031–25041.
- ↵P.M. Pryciak,H.E. Varmus,(1992) Nucleosomes, DNA-binding proteins, and DNA sequence modulate retroviral integration target site selection. Cell 69:769–780.
- P.M. Pryciak,H.P. Muller,H.E. Varmus,(1992) Simian virus 40 minichromosomes as targets for retroviral integration in vivo. Proc. Natl. Acad. Sci. 89:9237–9241.
- ↵T.J. Richmond,C.A. Davey,(2003) The structure of DNA in the nucleosome core. Nature 423:145–150.
- ↵H. Riethman,A. Ambrosini,C. Castaneda,J. Finklestein,X.L. Hu,U. Mudunuri,S. Paul,J. Wei,(2004) Mapping and initial analysis of human subtelomeric sequence assemblies. Genome Res. 14:18–28.
- ↵S.C. Satchwell,H.R. Drew,A.A. Travers,(1986) Sequence periodicities in chicken nucleosome core DNA. J. Mol. Biol. 191:659–675.
- ↵A.R. Schroder,P. Shinn,H. Chen,C. Berry,J.R. Ecker,F. Bushman,(2002) HIV-1 integration in the human genome favors active genes and local hotspots. Cell 110:521–529.
- ↵E. Segal,Y. Fondufe-Mittendorf,L. Chen,A. Thastrom,Y. Field,I.K. Moore,J.P. Wang,J. Widom,(2006) A genomic code for nucleosome positioning. Nature 442:772–778.
- ↵S.W. Stevens,J.D. Griffith,(1996) Sequence analysis of the human DNA flanking sites of human immunodeficiency virus type 1 integration. J. Virol. 70:6459–6462.
- ↵K.D. Taganov,I. Cuesta,R. Daniel,L.A. Cirillo,R.A. Katz,K.S. Zaret,A.M. Skalka,(2004) Integrase-specific enhancement and suppression of retroviral DNA integration by compacted chromatin structure in vitro. J. Virol. 78:5848–5855.
- ↵F. Turlure,E. Devroe,P.A. Silver,A. Engelman,(2004) Human cell proteins and human immunodeficiency virus DNA integration. Front. Biosci. 9:3187–3208.
- ↵N. Vandegraaff,E. Devroe,F. Turlure,P.A. Silver,A. Engelman,(2006) Biochemical and genetic analyses of integrase-interacting protein lens epithelium-derived growth factor (LEDGF)/p75 and hepatoma-derived growth factor related protein 2 (HRP2) in preintegration complex function and HIV-1 replication. Virology 346:415–426.
- ↵X. Wu,Y. Li,B. Crise,S.M. Burgess,(2003) Transcription start regions in the human genome are favored targets for MLV integration. Science 300:1749–1751.
- ↵X. Wu,Y. Li,B. Crise,S.M. Burgess,D.J. Munroe,(2005) Weak palindromic consensus sequences are a common feature found at the integration target sites of many retroviruses. J. Virol. 79:5211–5214.
Notes
[1] [Supplemental material is available online at www.genome.org. The sequence data from this study have been submitted to GenBank under accession nos. EI522403–EI666579, and the raw data for transcriptional profiling have been deposited in NCBI Gene Expression Omnibus under accession no. GSE7508.]
[2] Article published online before print. Article and publication date are at http://www.genome.org/cgi/doi/10.1101/gr.6286907